
AI Pipeline Engineering Guide #1
Introduction
In this AI Pipeline Engineering Guide #1, we will cover some fundamentals of building AI pipelines using tttc-turbo, as well as provide a step by step guide for CSV ingestion and report cluster extraction.
The intended audience for these guides is:
- Power users of software in general / technically inclined users.
- AI / ML practitioners and researchers.
- Software developers / engineers
- Pipeline engineers and architects of all sorts.
By going through these guides. you can become the goto Engineer for:
- Creating new reports of your own design
- Modifying / Enhancing existing reports after feedback rounds.
- Publishing reports as templates that can be used by reporters.
Please note this guide does not require any coding experience or expertise.
AI Pipeline Engineering as a building blocks set
Let's attempt a first analogy to keep in mind throughout these guides and beyond: think of tttc-turbo as a building blocks set. Everything you see on the screen is a block in the building blocks set.
These building blocks can be as simple as text boxes or markdown documents, CSV or JSON files; as mundane as data-wrangling nodes; or as powerful as AI and LLM blocks!
This also introduces a useful framework, where new functionality can be added by simply creating new blocks, or new versions of existing blocks, with the strong advantages of:
- Blocks as entities.
- New blocks and block versions do not disrupt existing pipelines.
- Encapsulation.
- Test-driven 'block' development.
- Block reusability.
- Block modularity.
- Upgrade paths, for upgrading existing blocks to their new versions.
- etc.
Recommended Setup
A dual screen setup is strongly recommended.
- One screen for the guide.
- A second screen for operating tttc-turbo.
Initial Report Creation
- On your second 'operation' screen:
- Navigate to the home screen.
- Sign in.
- Create a new report based on the blank template.
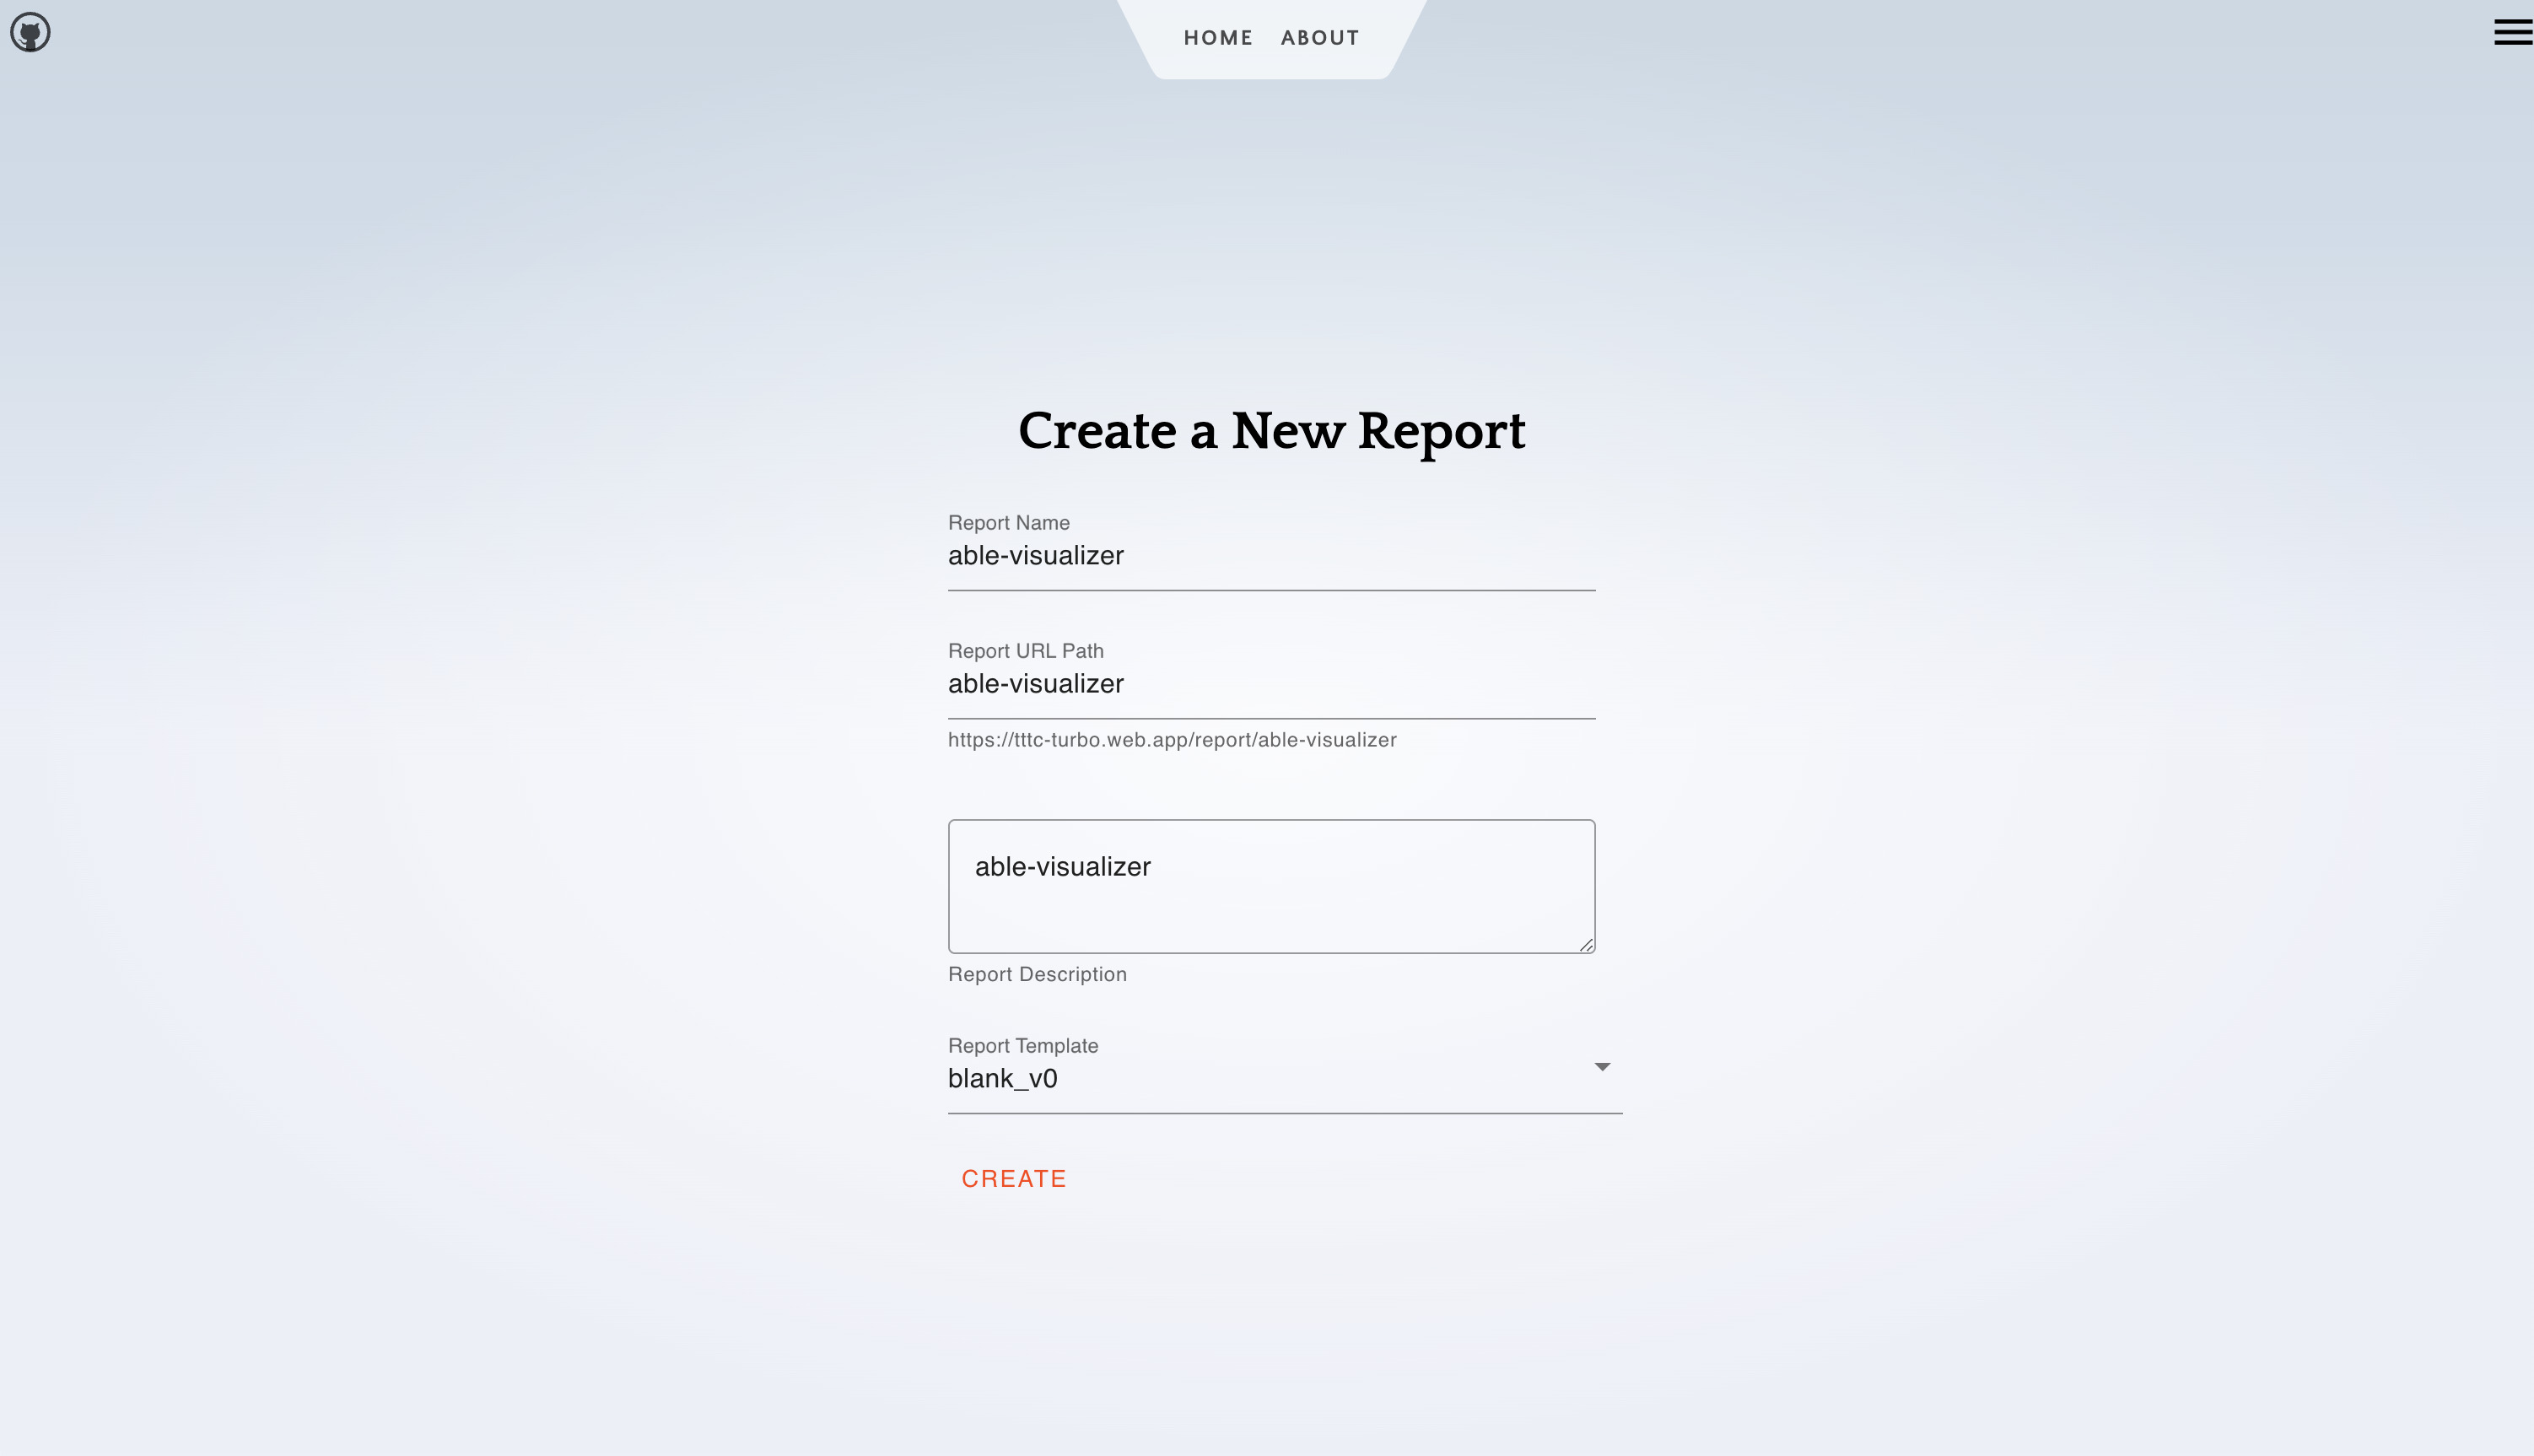
N.B you are recommended to keep the slug (the url) in latin alphabet, as some browsers have issues with extended unicode URLs.
Standard View
After creating a new blank report, you enter your preferred view. By default this is the standard view. The standard view is used by reporters to upload their CSV and run the pipeline you have created for them.
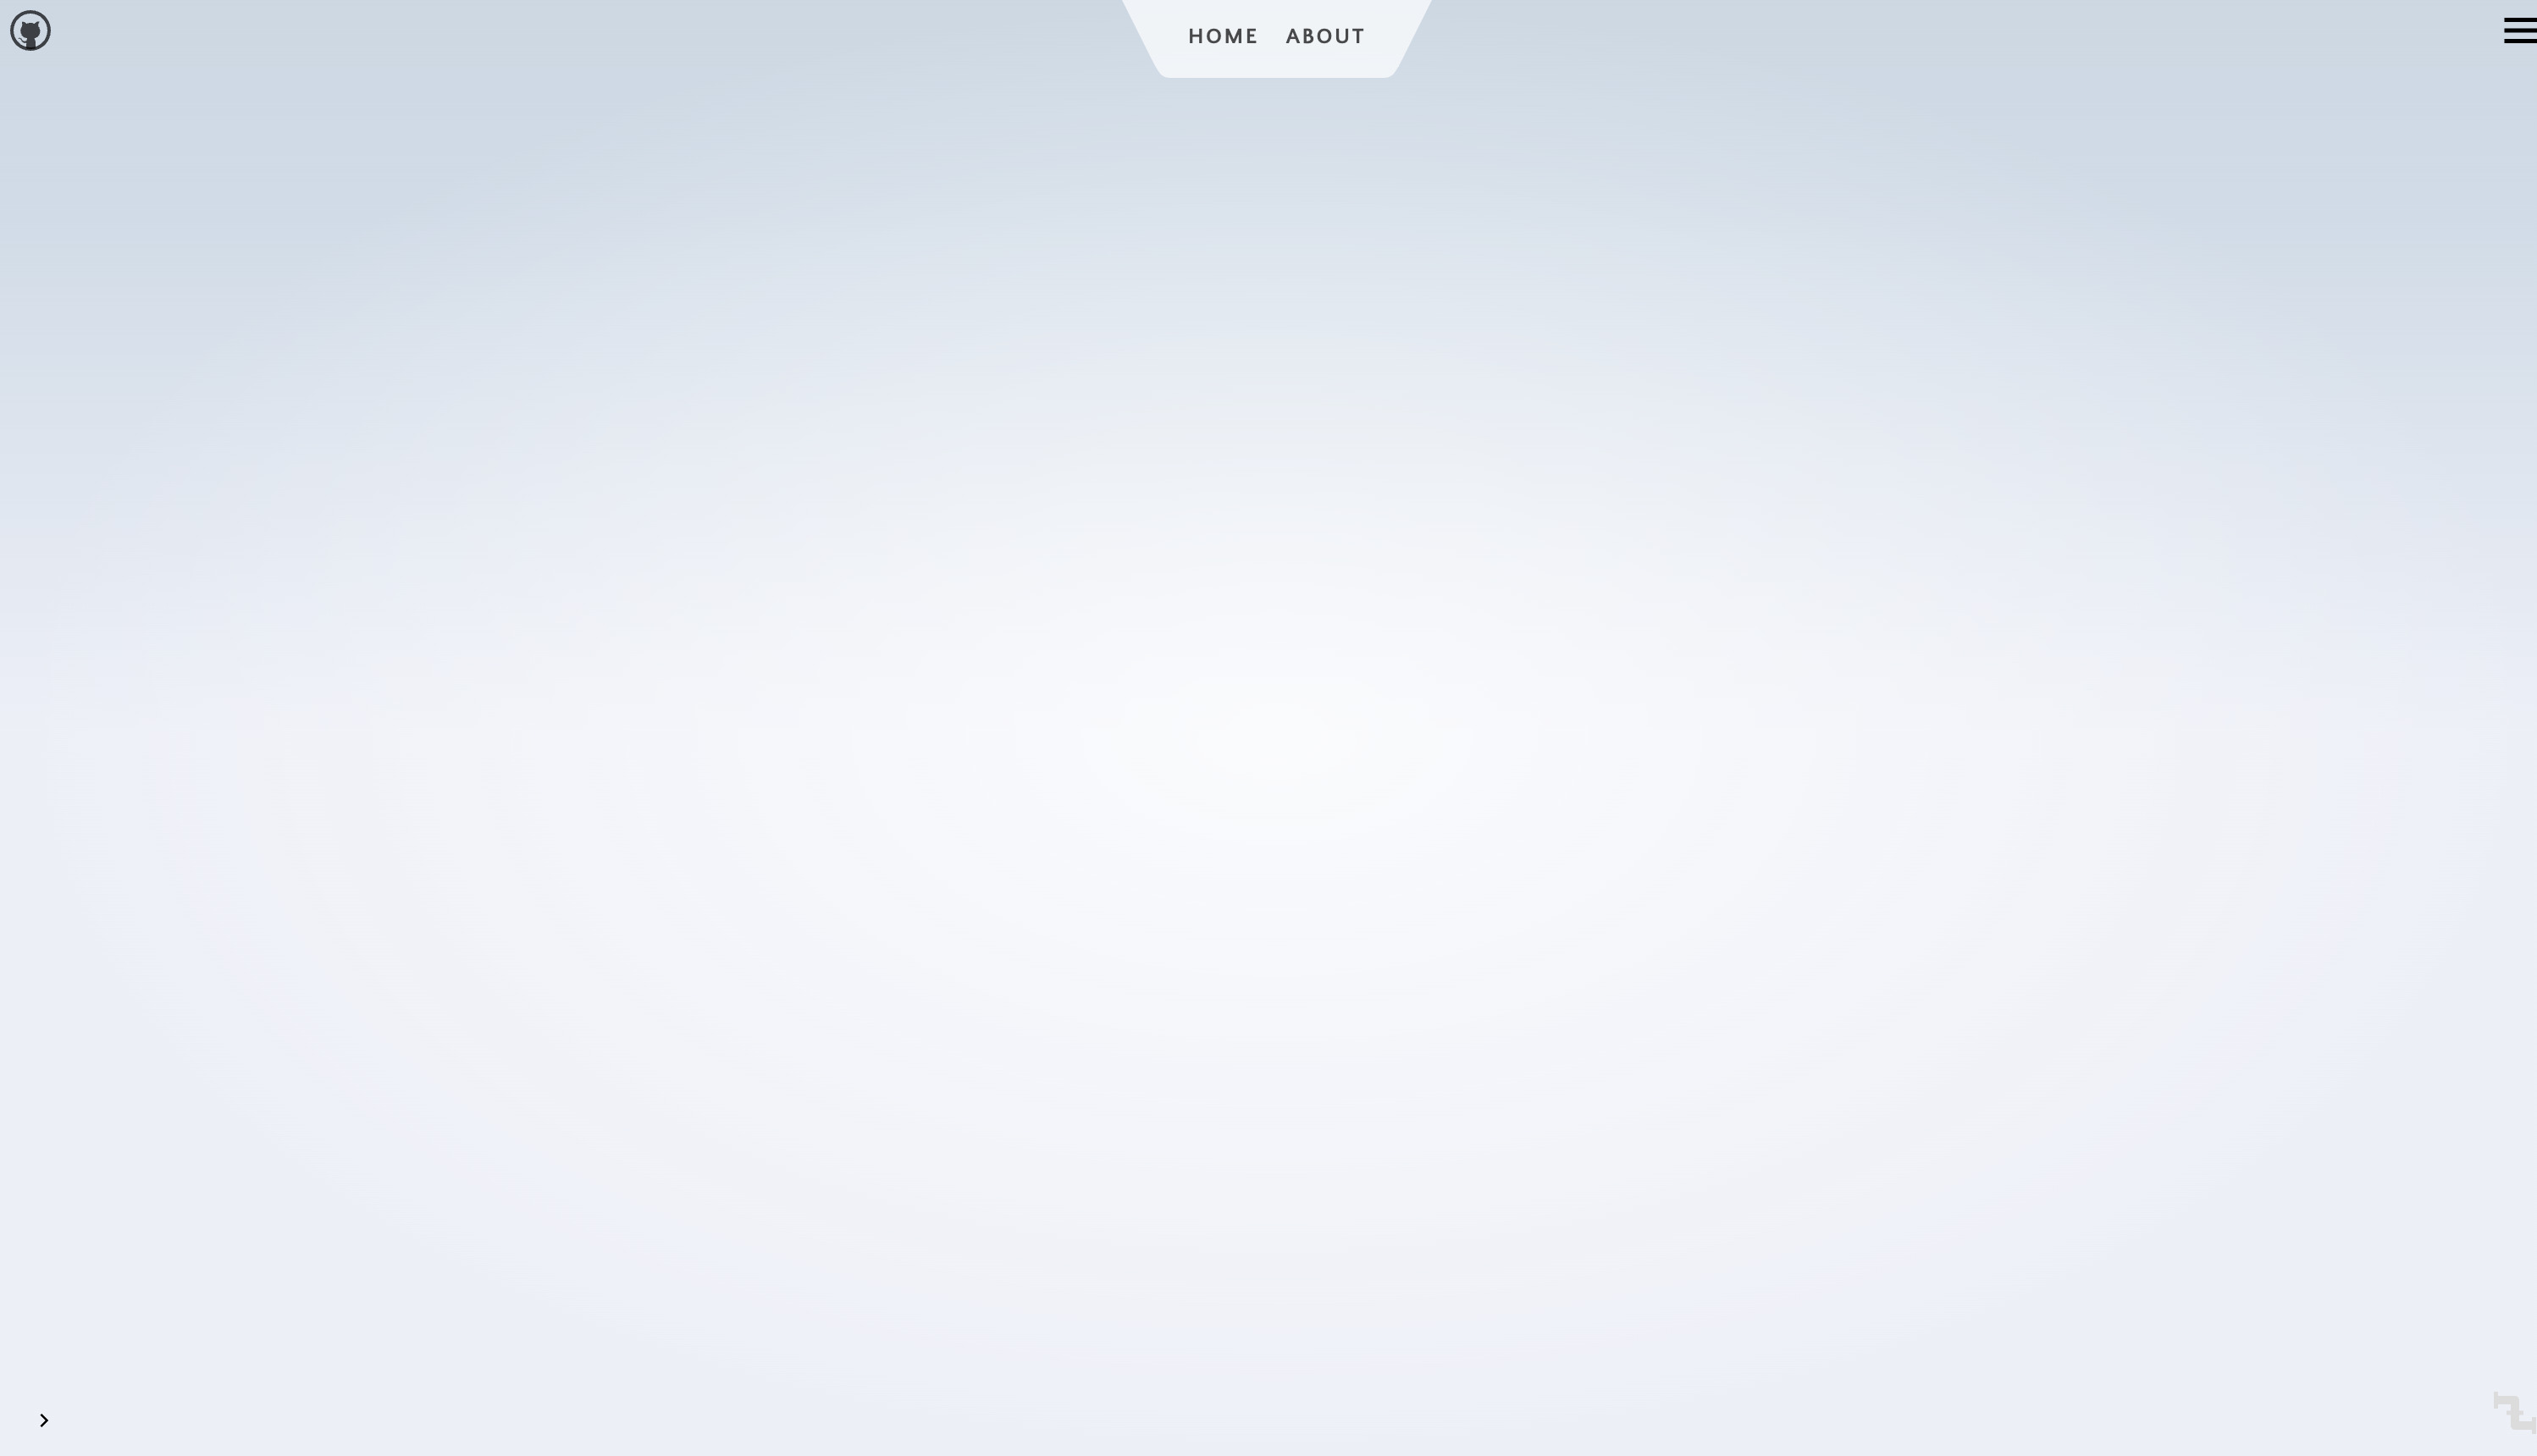
We will come back to the standard view later, after we have created UI components.
- In the top right menu, click on "graph view".
Graph view
In the "Graph View" UI components are referred to as "nodes". We haven't created any, but are about to!
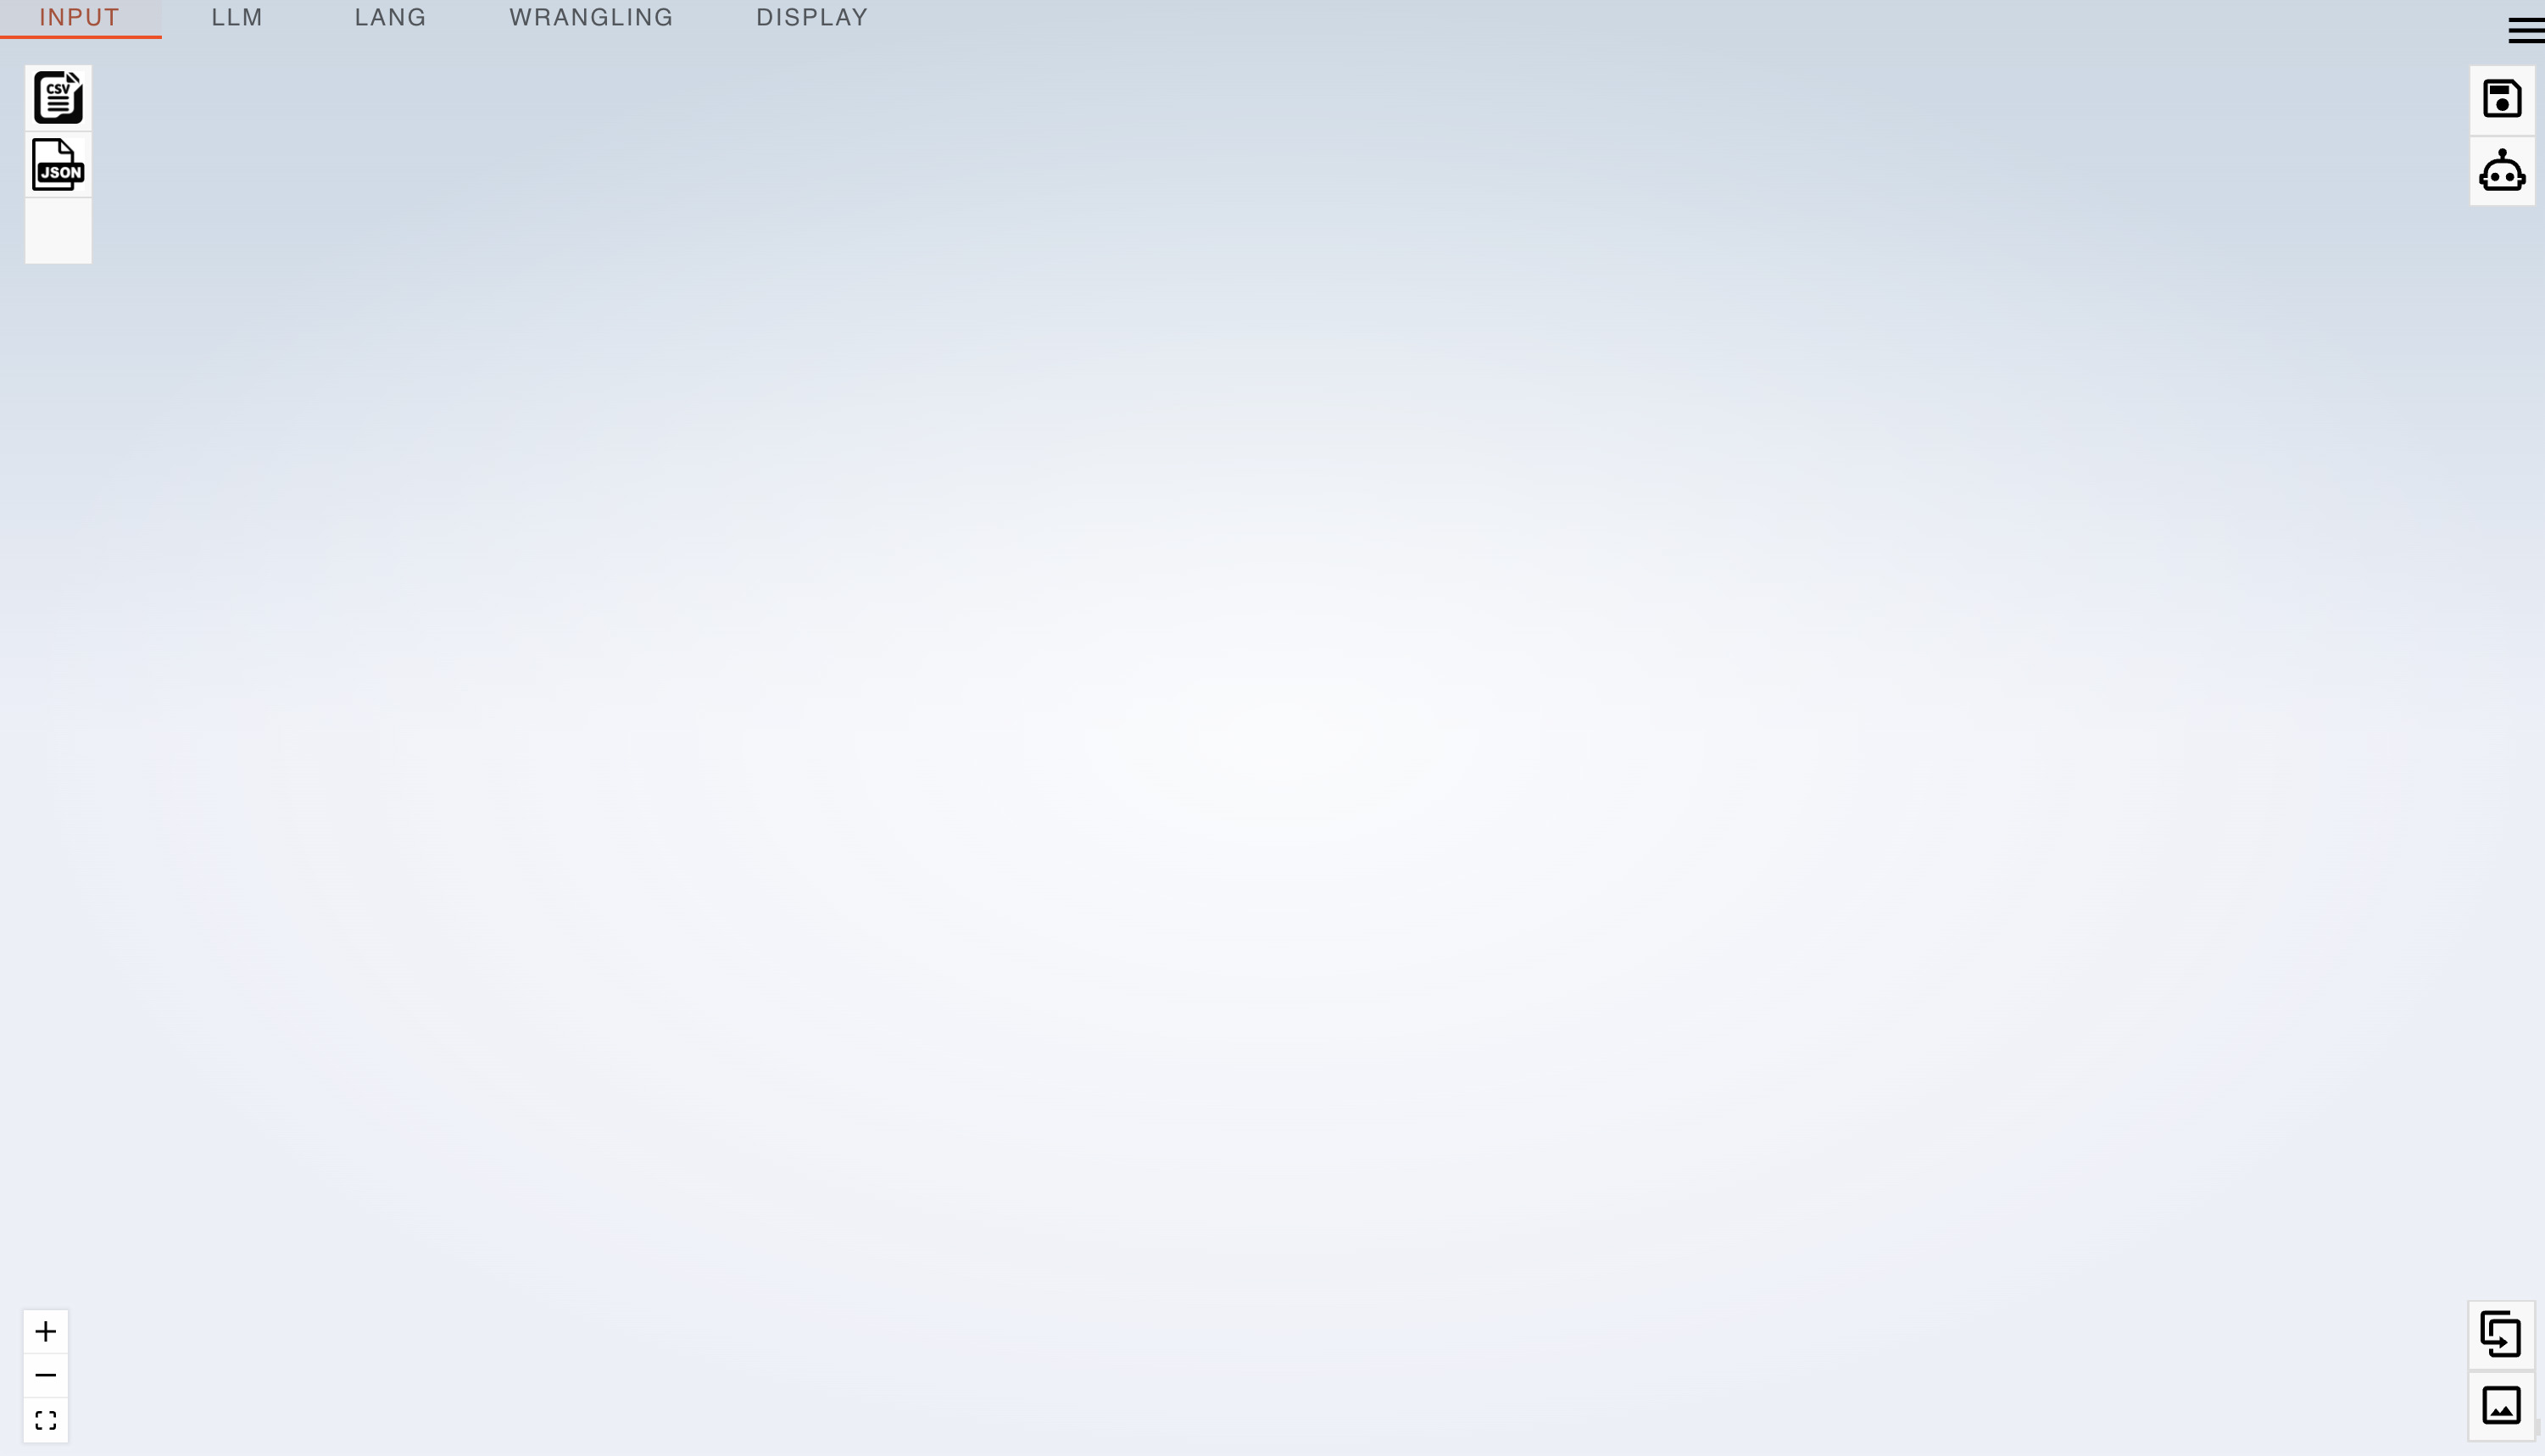
At the top left of the graph view:
- Click on Input
- Drag a "CSV" into the center of the graph view.
- Click the "Save" icon at the top right of the screen (remember to do this often).
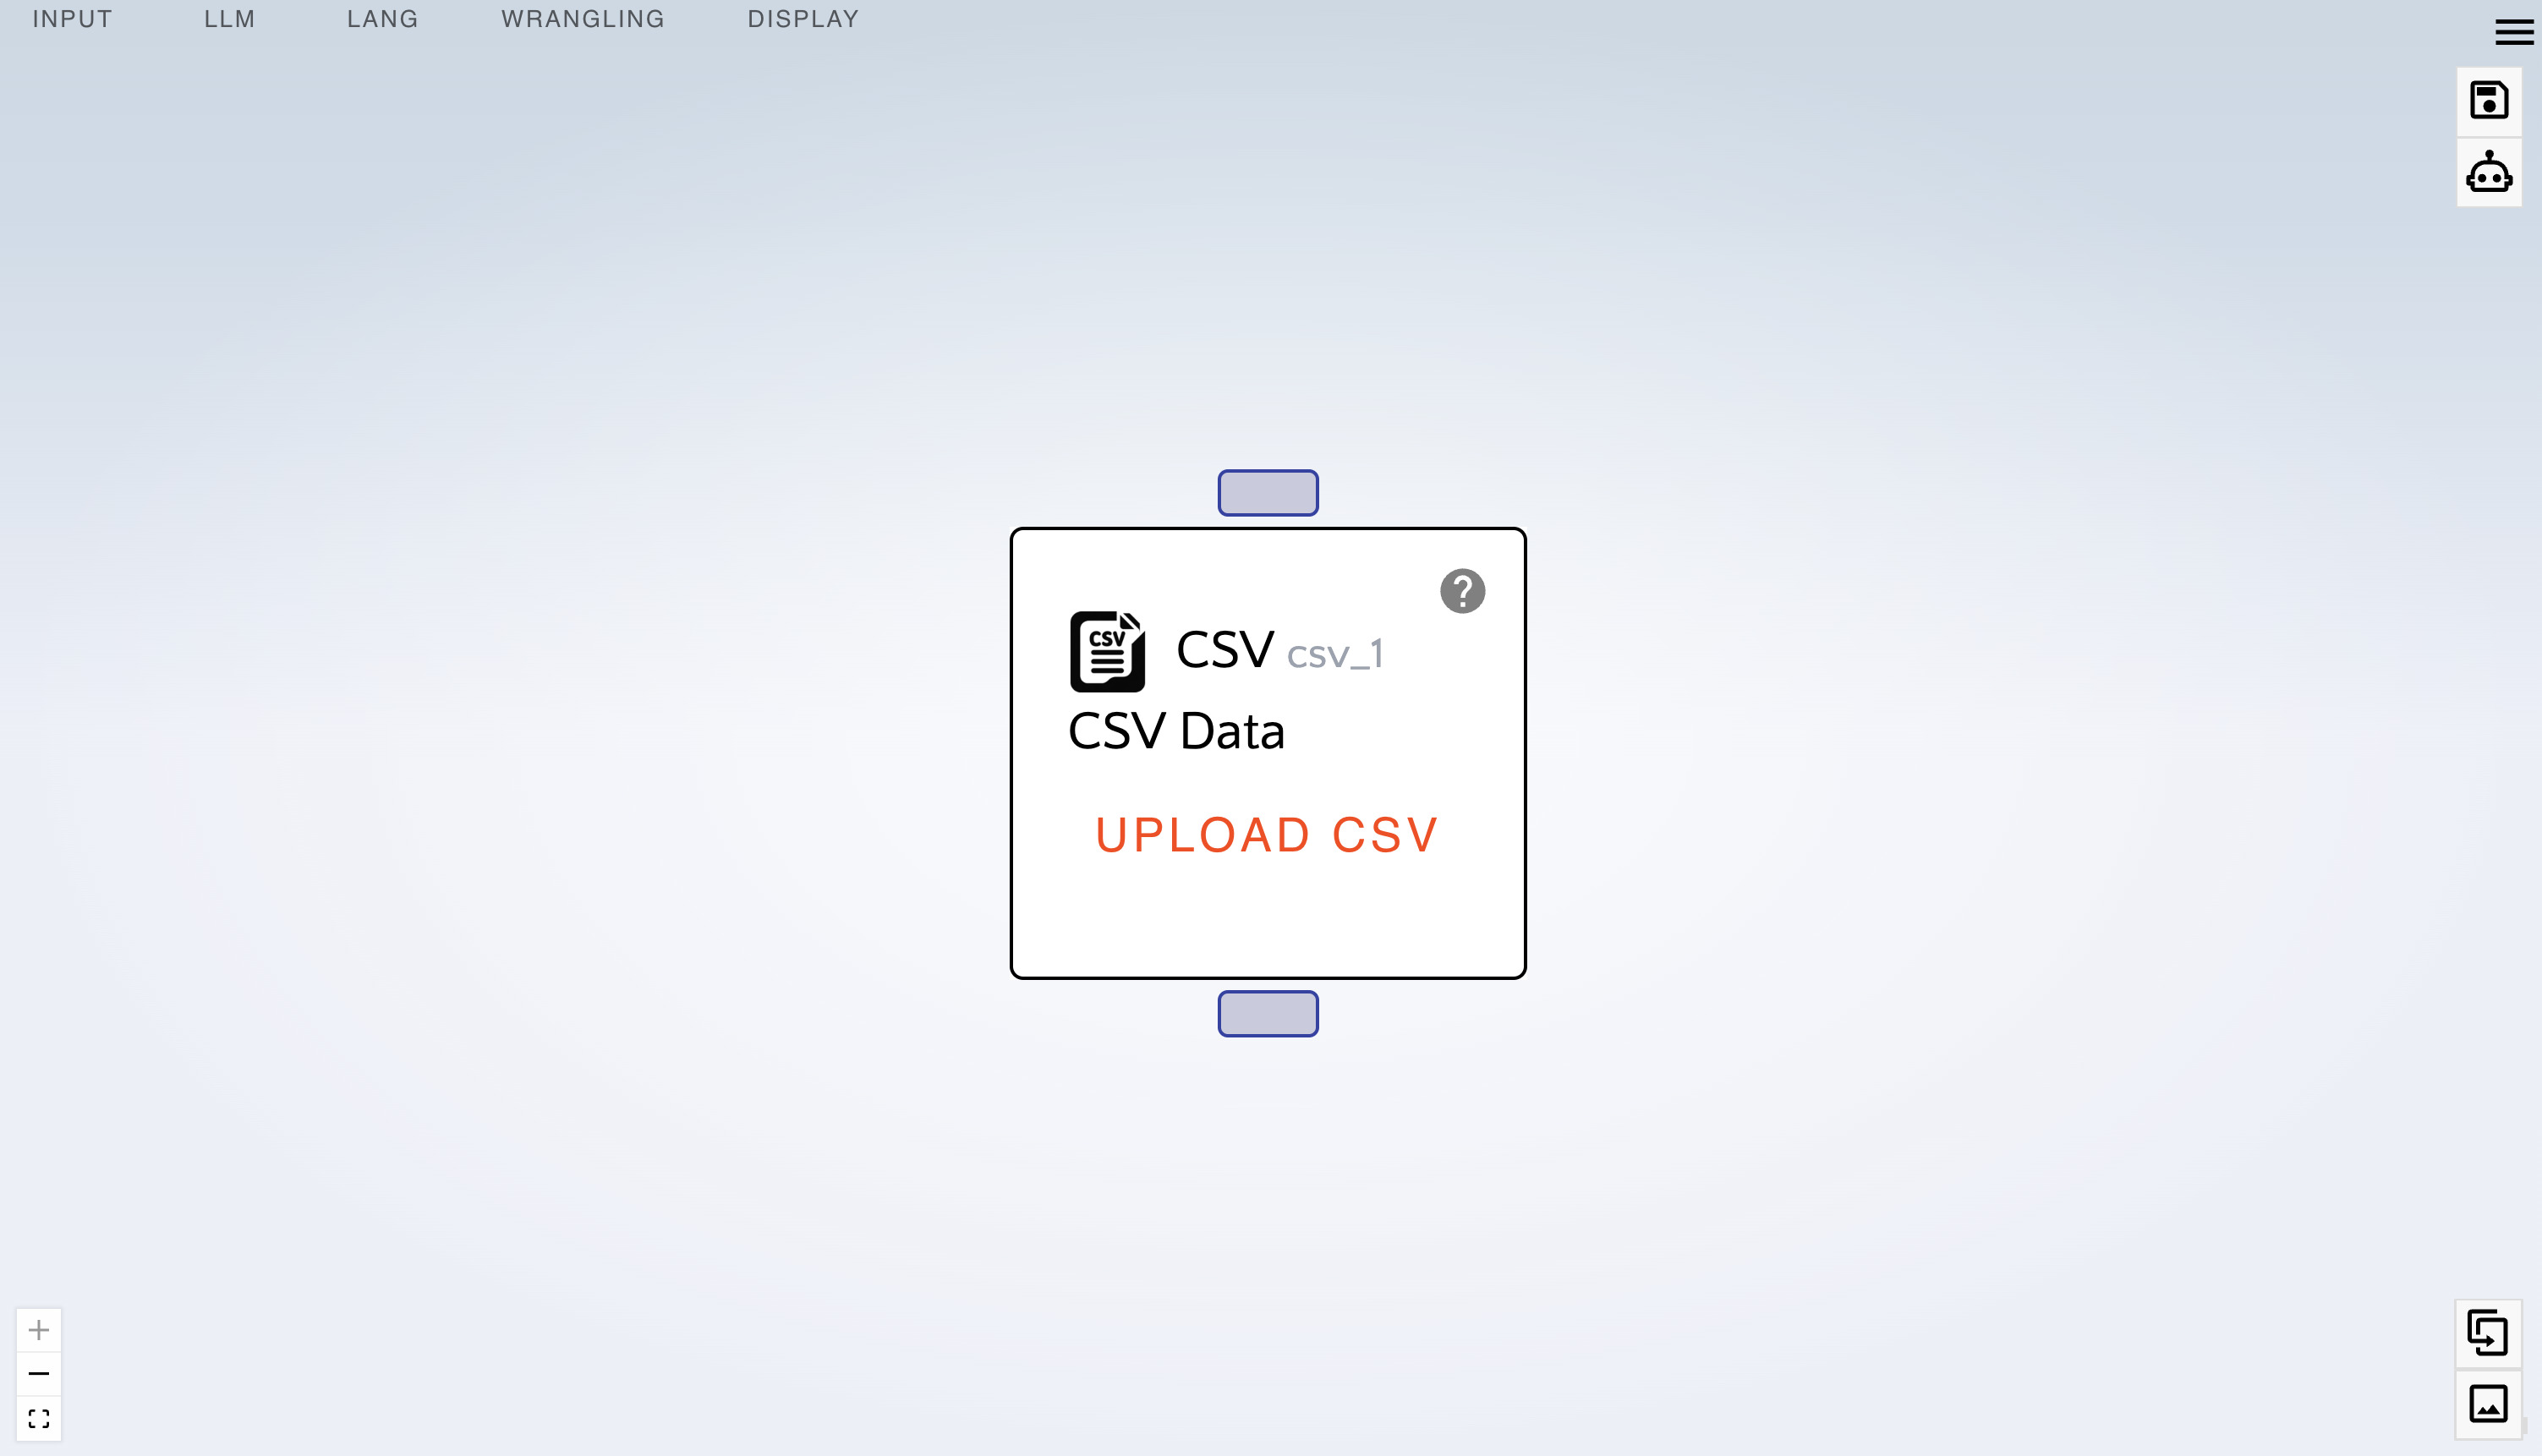
- Notice that you can:
- zoom in and out with your mouse wheel or track pad
- pan by click-dragging the background
- select the node by clicking on it
- deselect the node by clicking on the background
- move the node around by click-dragging it
- press shift on your keyboard, and click-dragging to select multiple nodes
- Click on the question mark to display the help box.
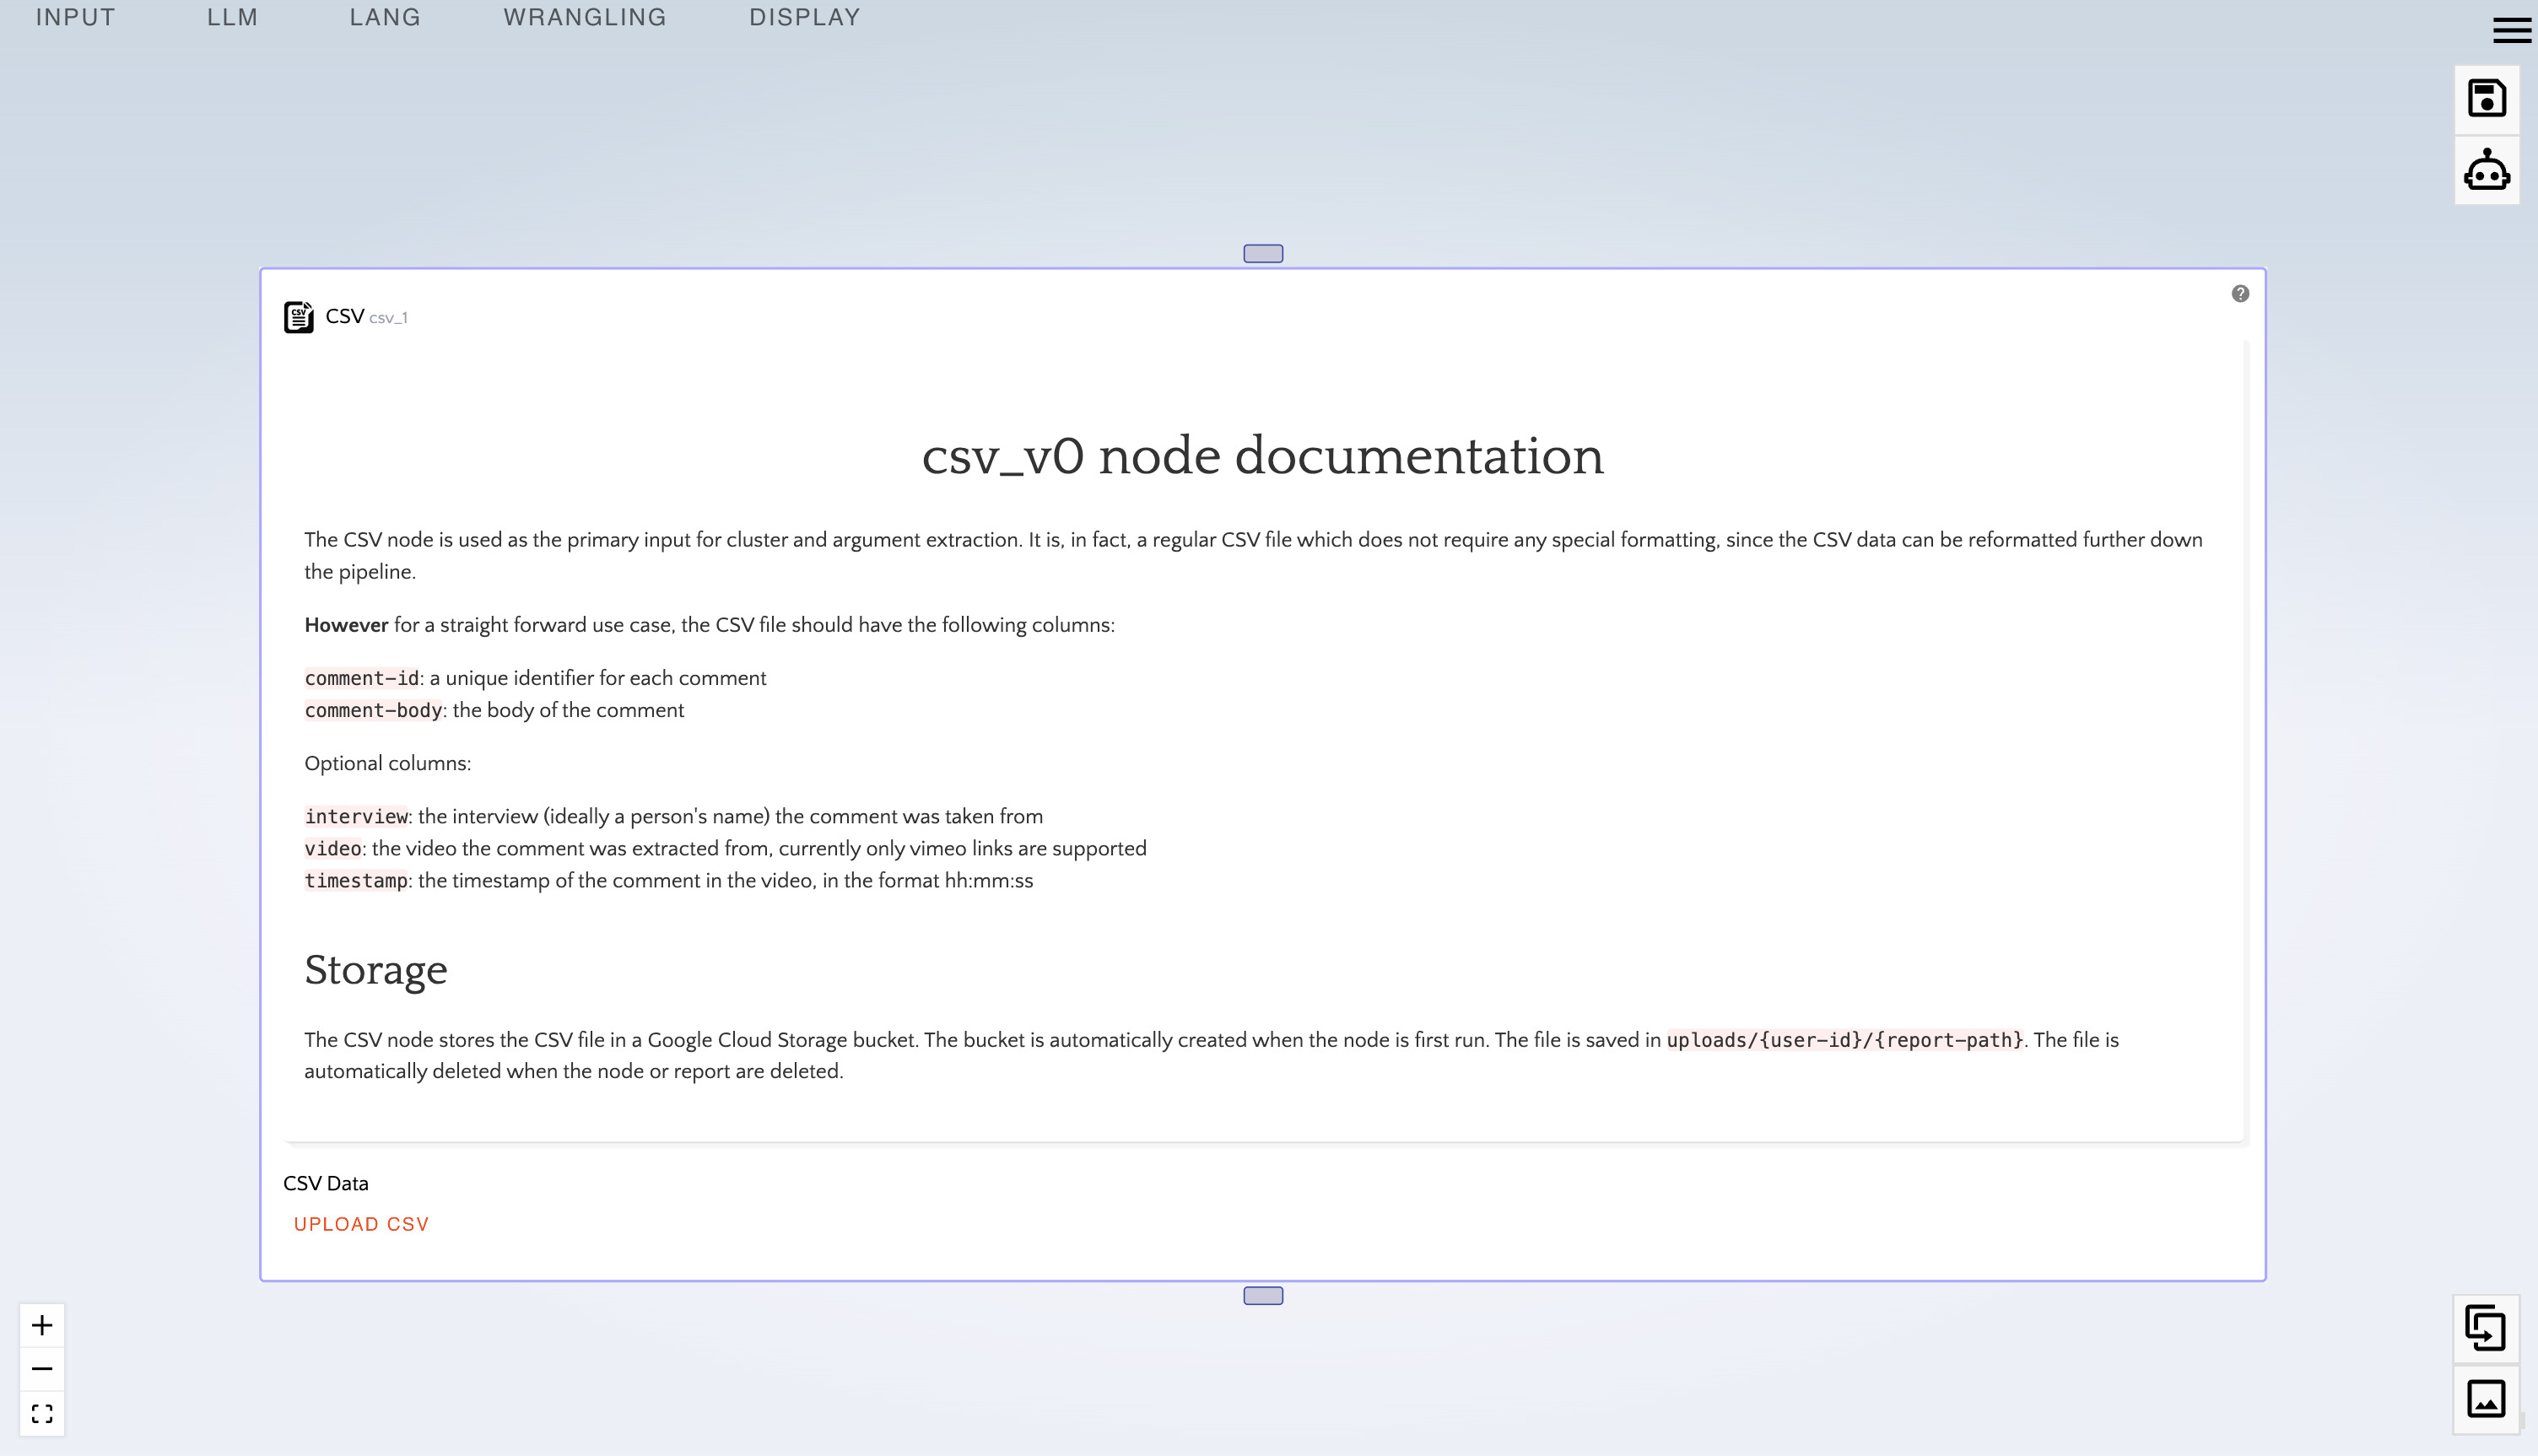
- Click on help again to close the node's help box.
- Create a file on your device, called "sample.csv"
- Paste the following in the file:
- In the "CSV" node click on the "Upload" button, and upload
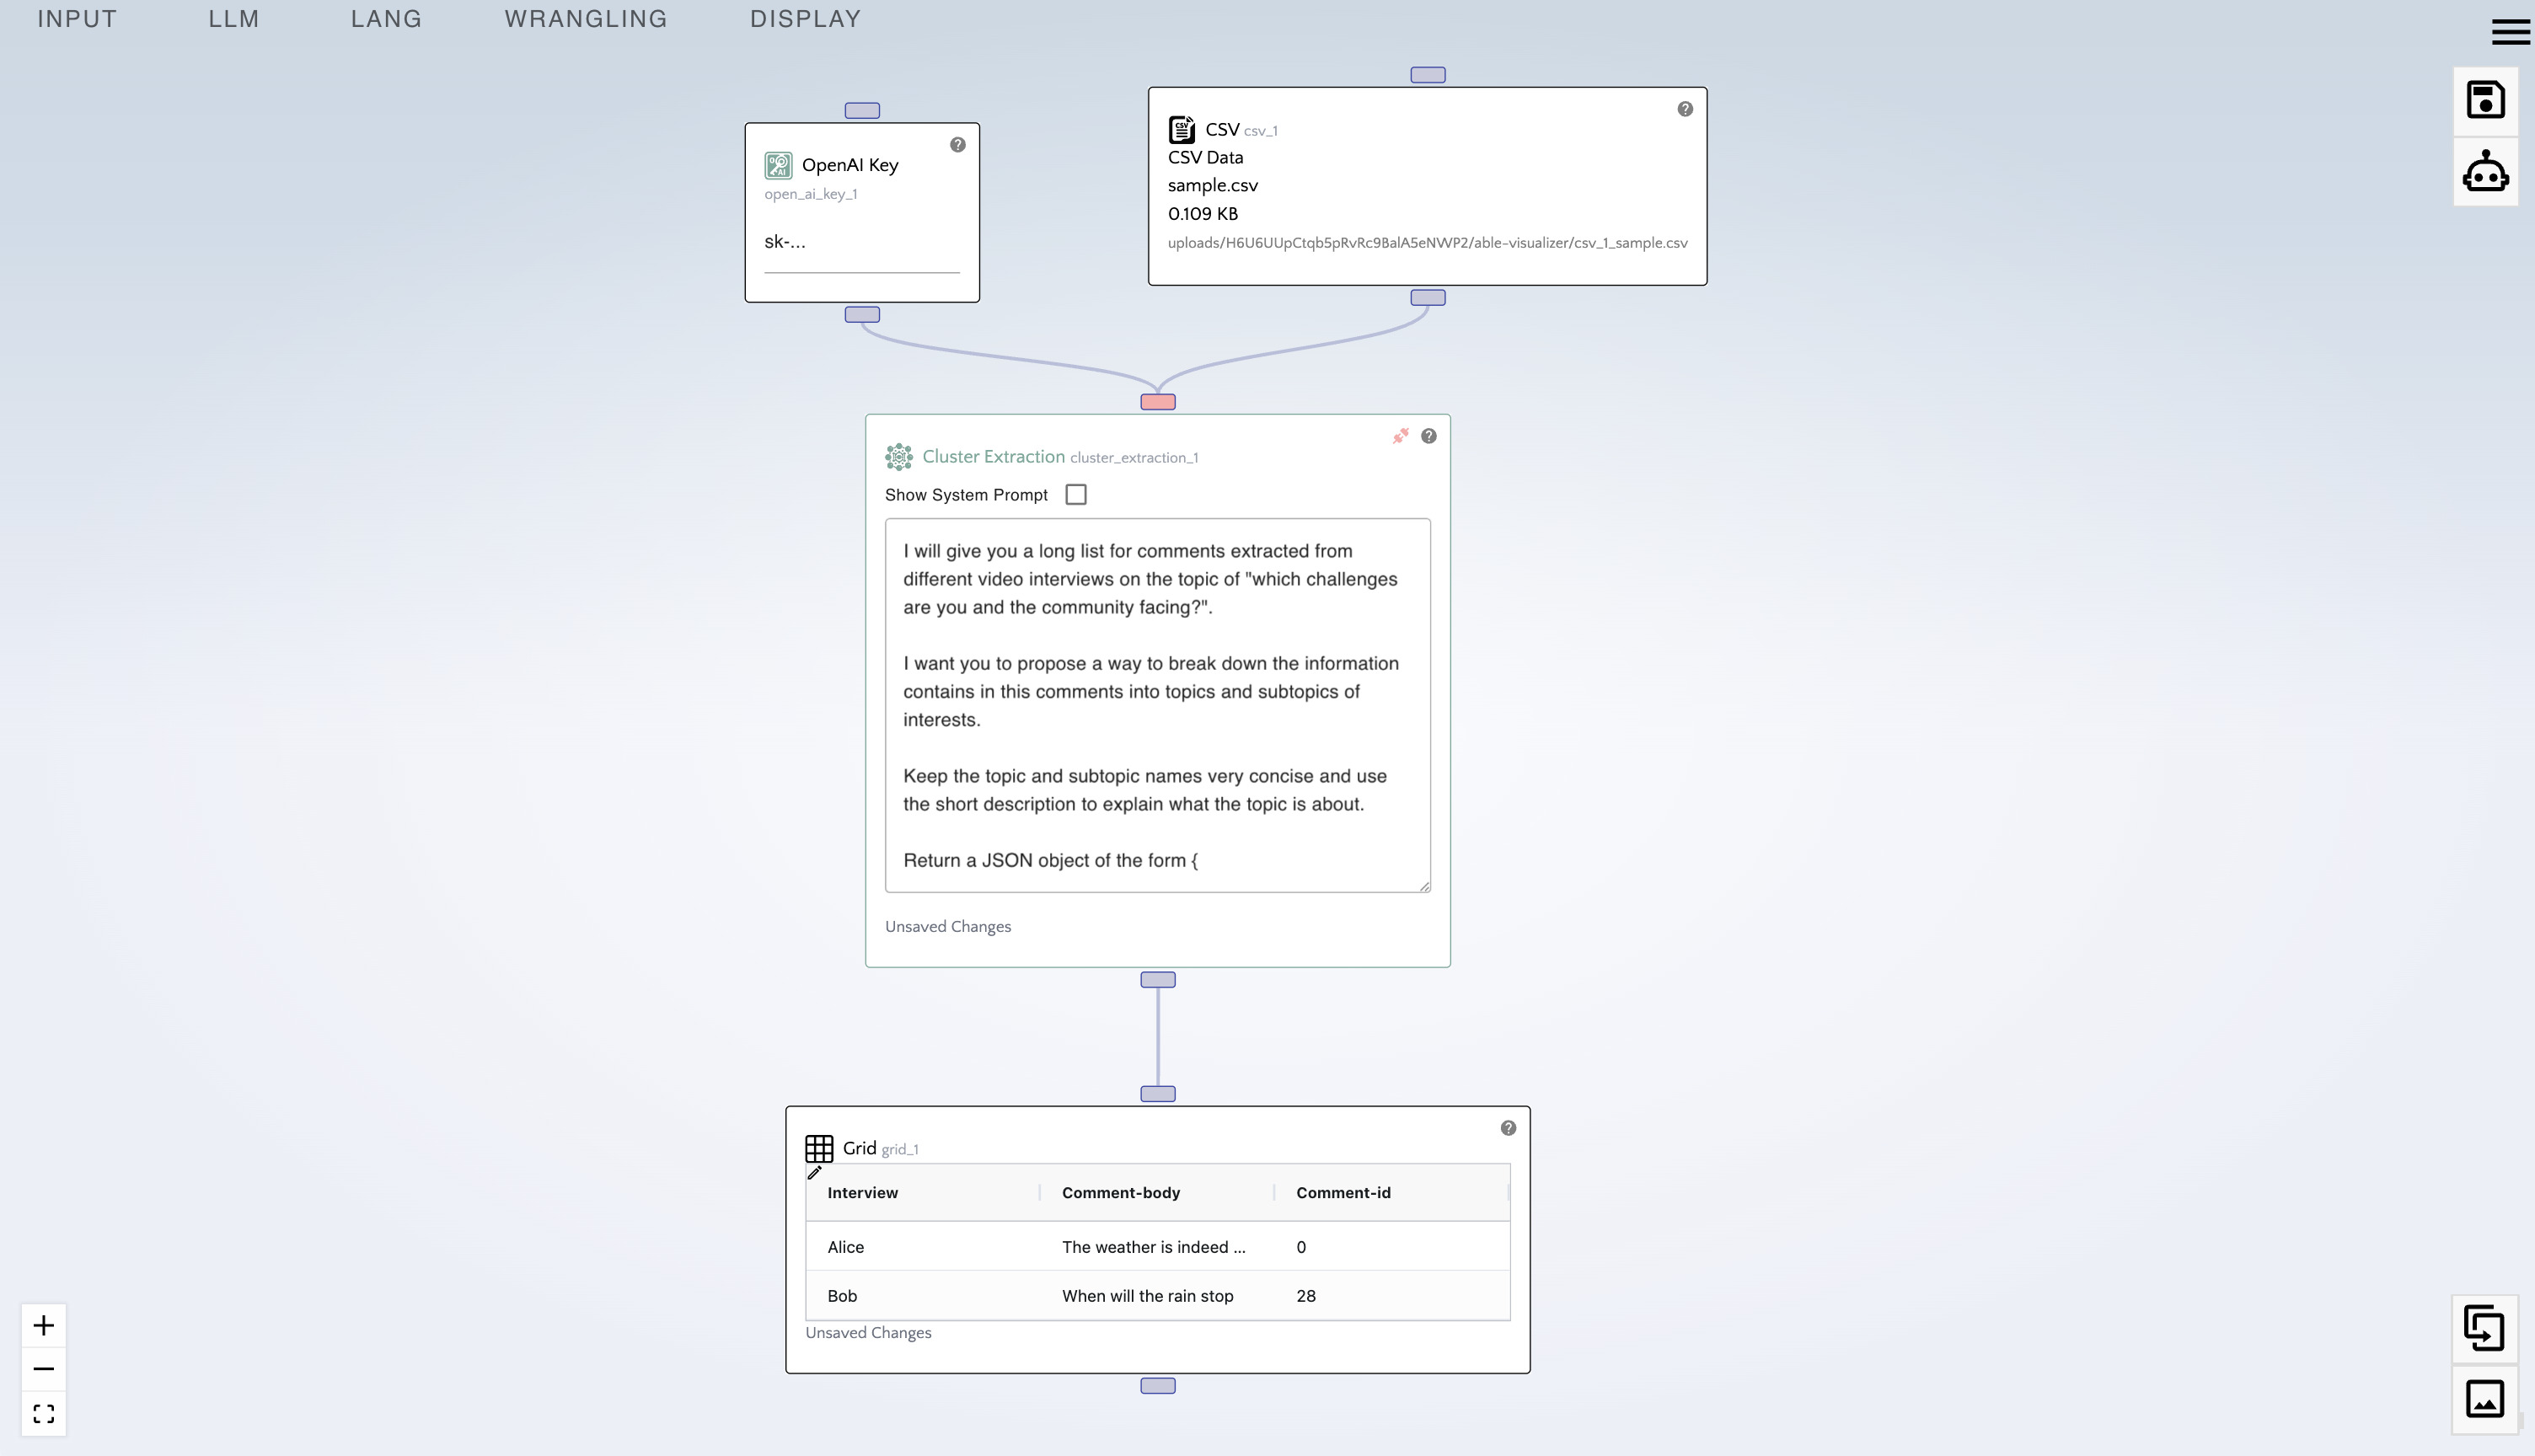
sample.csv. - From the display menu, drag in a "Grid" node under the "CSV" node.
- Connect the bottom handle of the "CSV" node.
- At the top right of the screen click on the Robot icon (generate report).
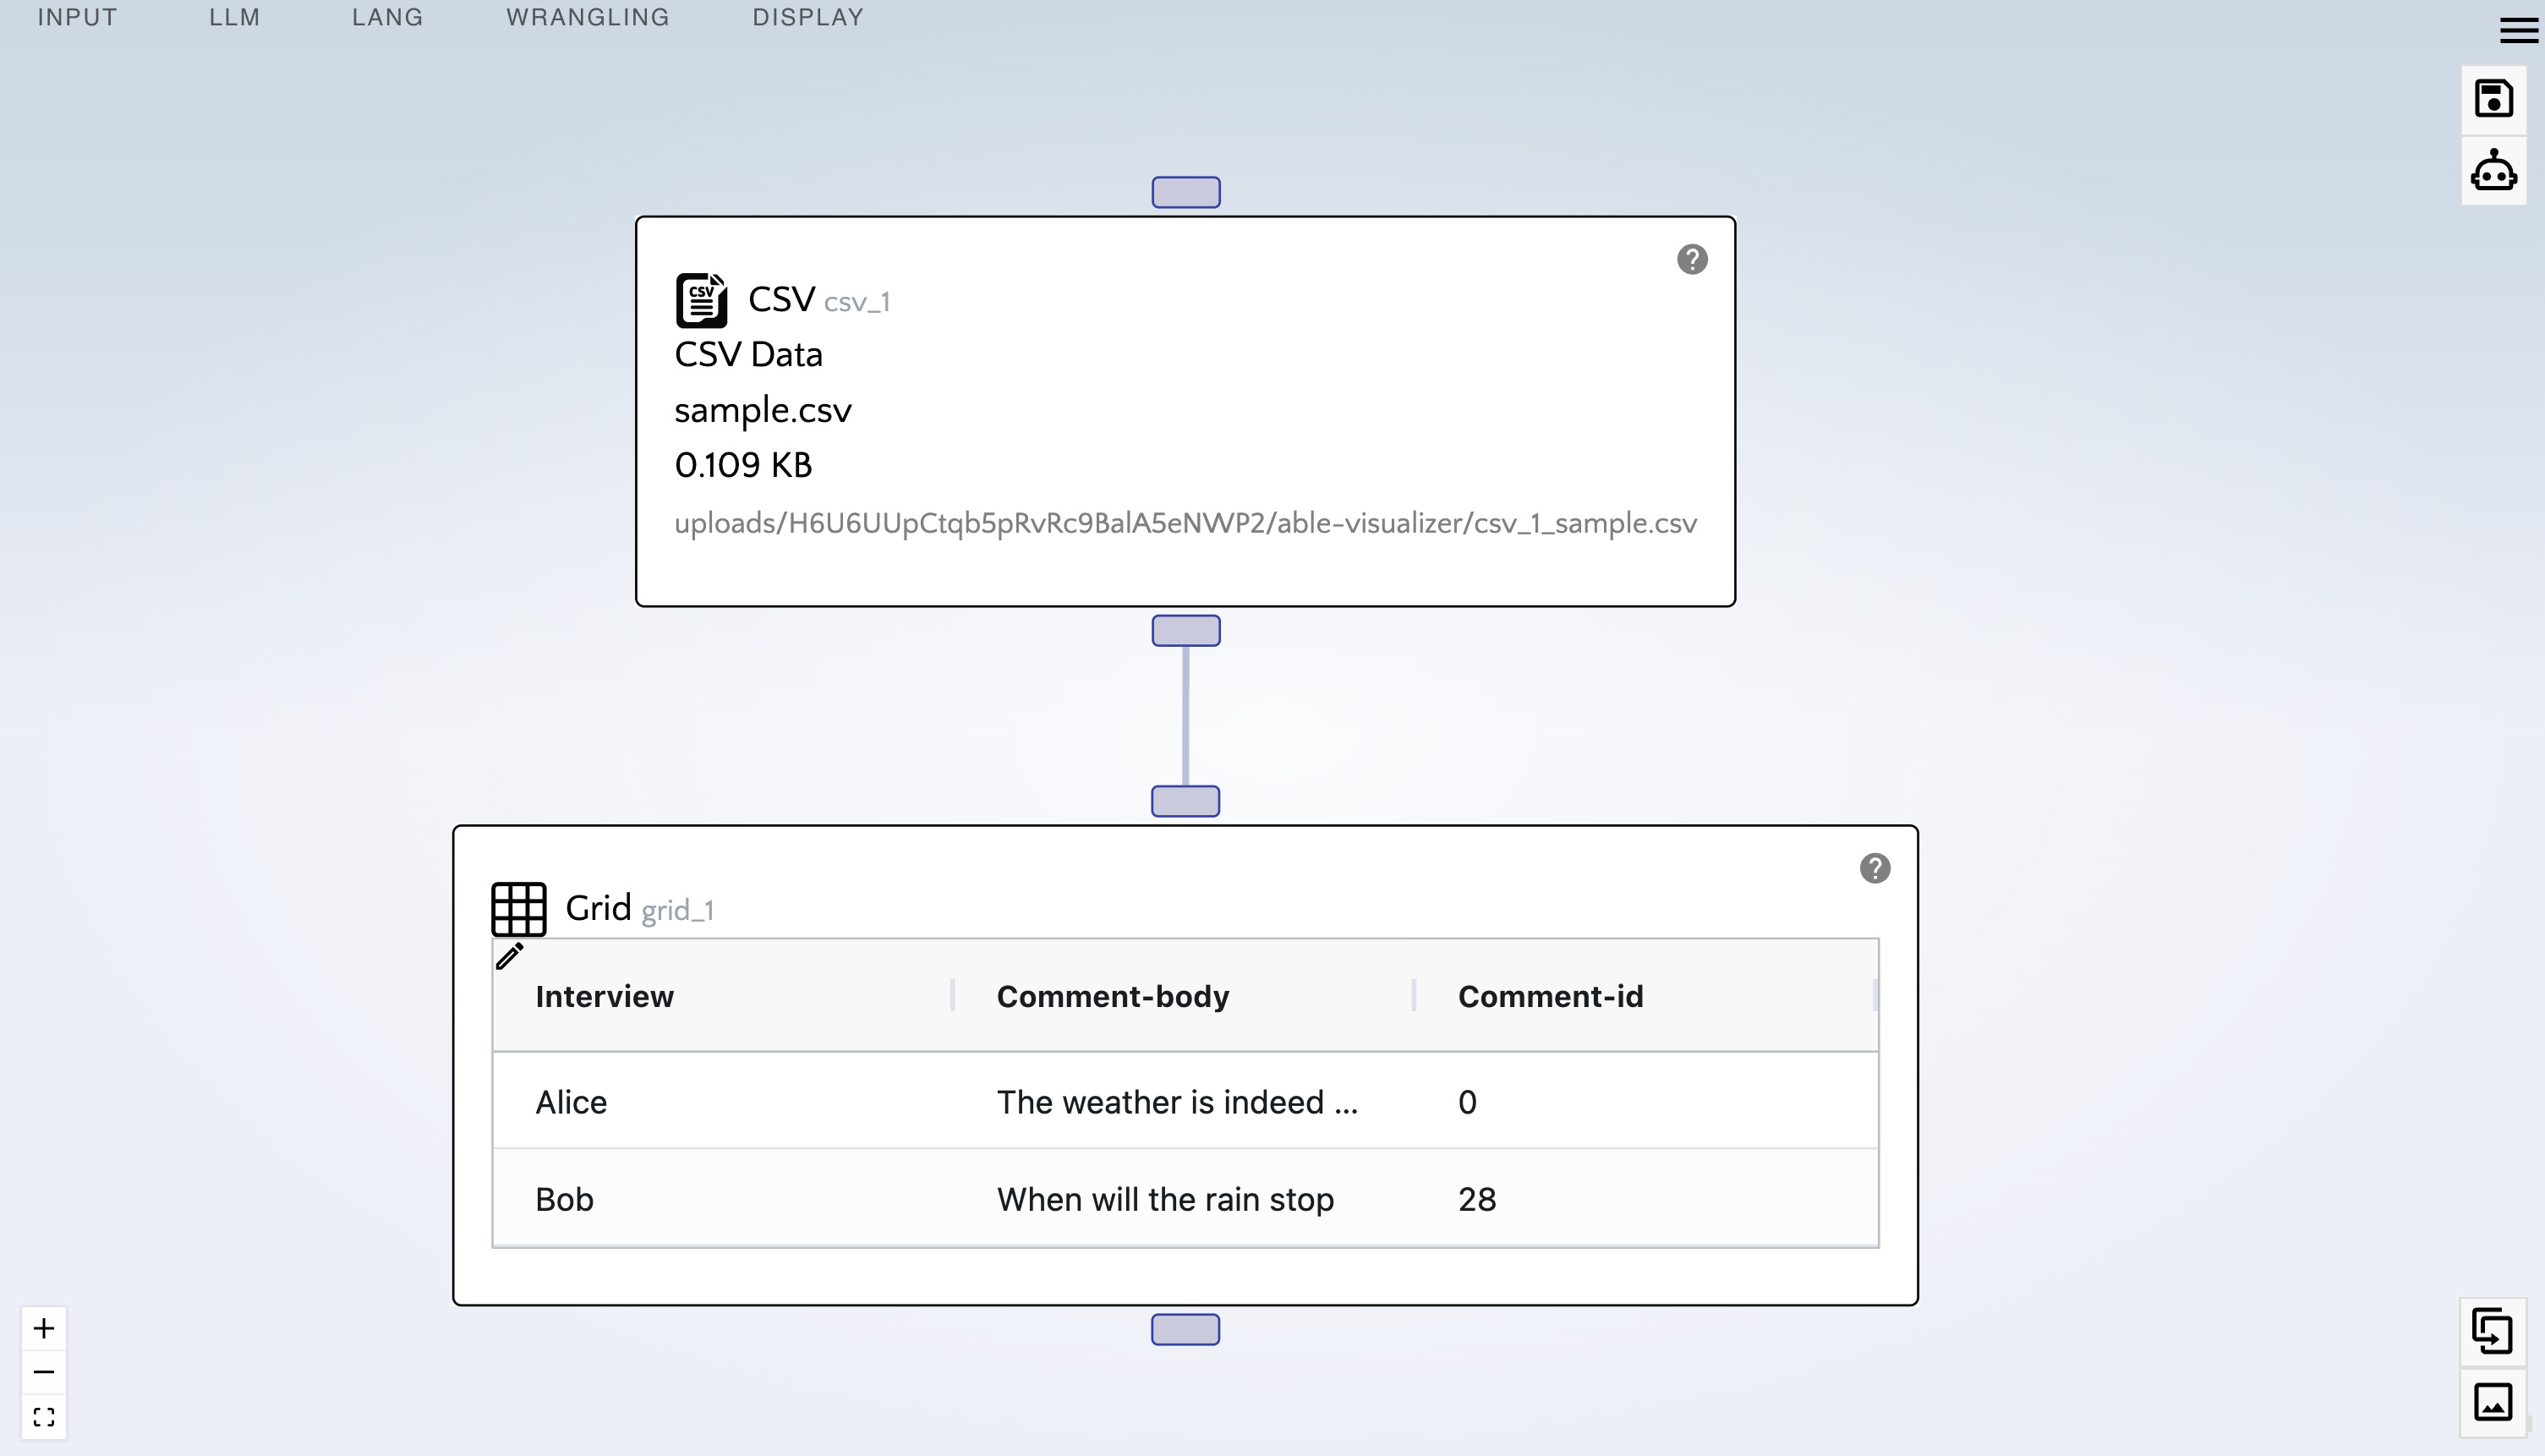
The "grid" node is extremely handy as it enables us to view data as it flows down our pipeline. It should be used extensively to gain clarity on our data as we progress through the AI pipeline creation process.
- Click on the pencil icon in the grid.
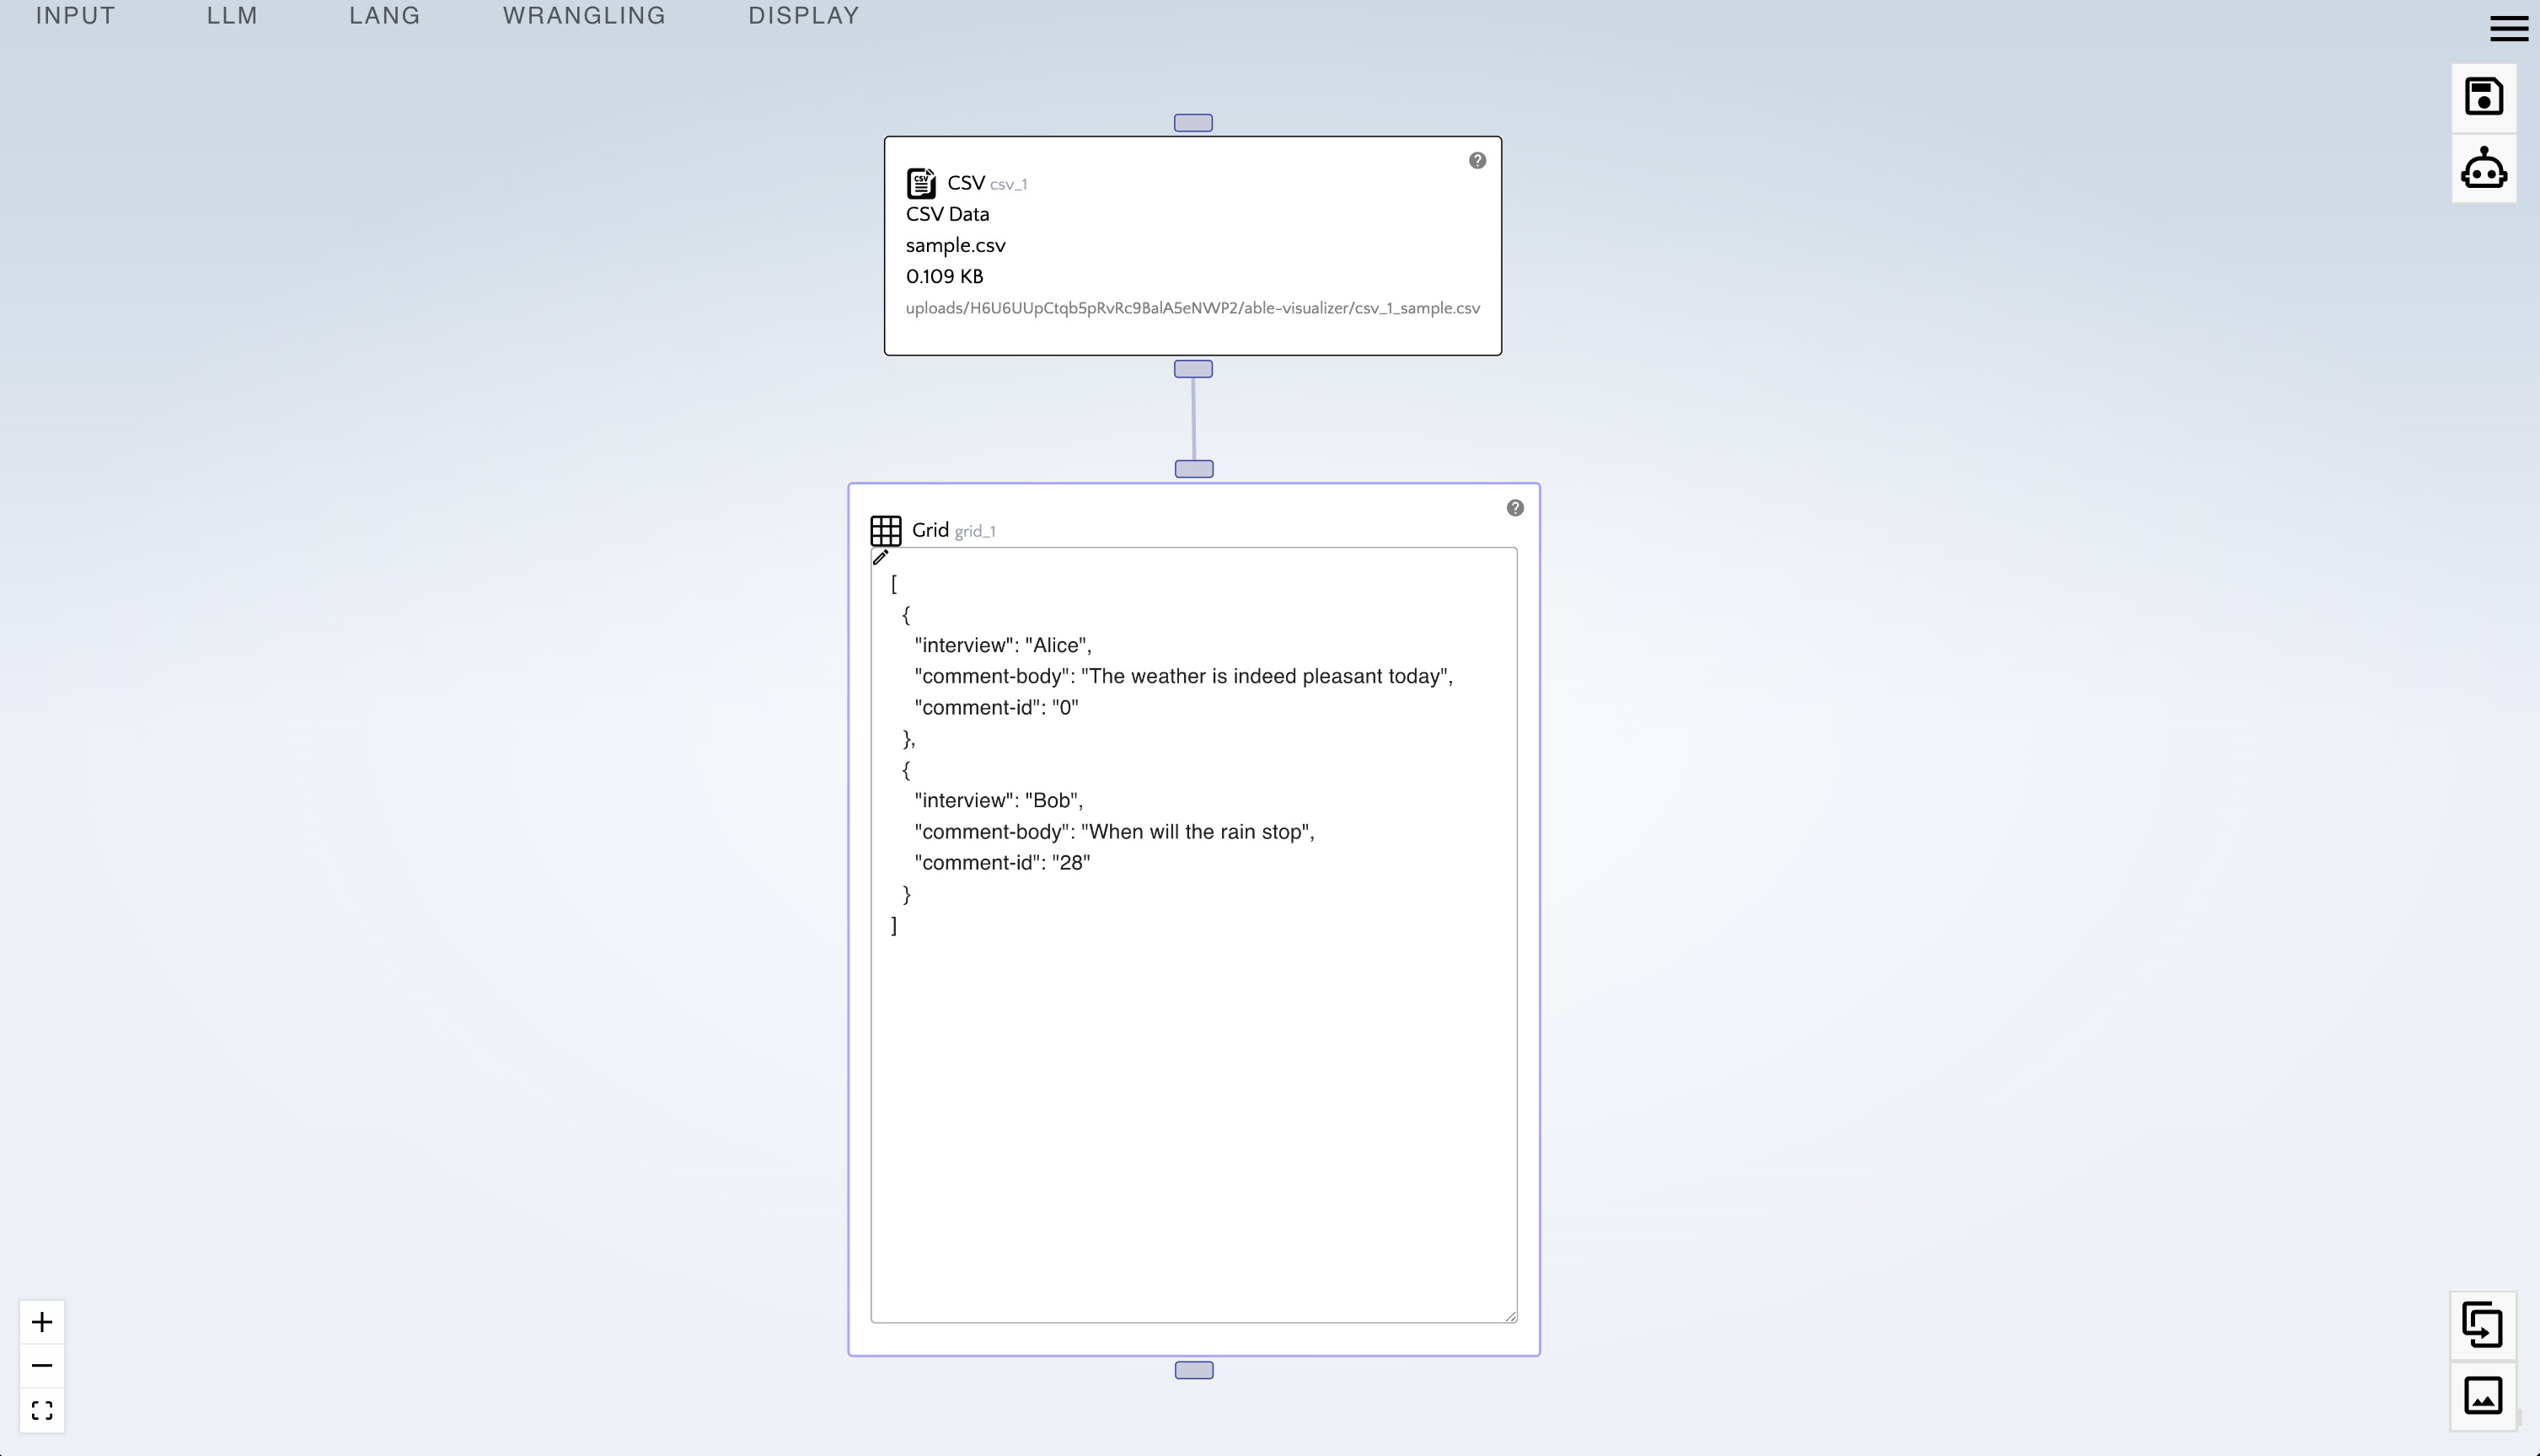
The grid node enables us to view our data in JSON format. Sometimes a pipeline can be as simple as uploading a CSV, making a few transformations, copying the resulting document from the grid, then deleting the report. In fact this kind of ephemeral workflow is highly recommended since the end product is not the pipeline itself, but rather the data it produces.
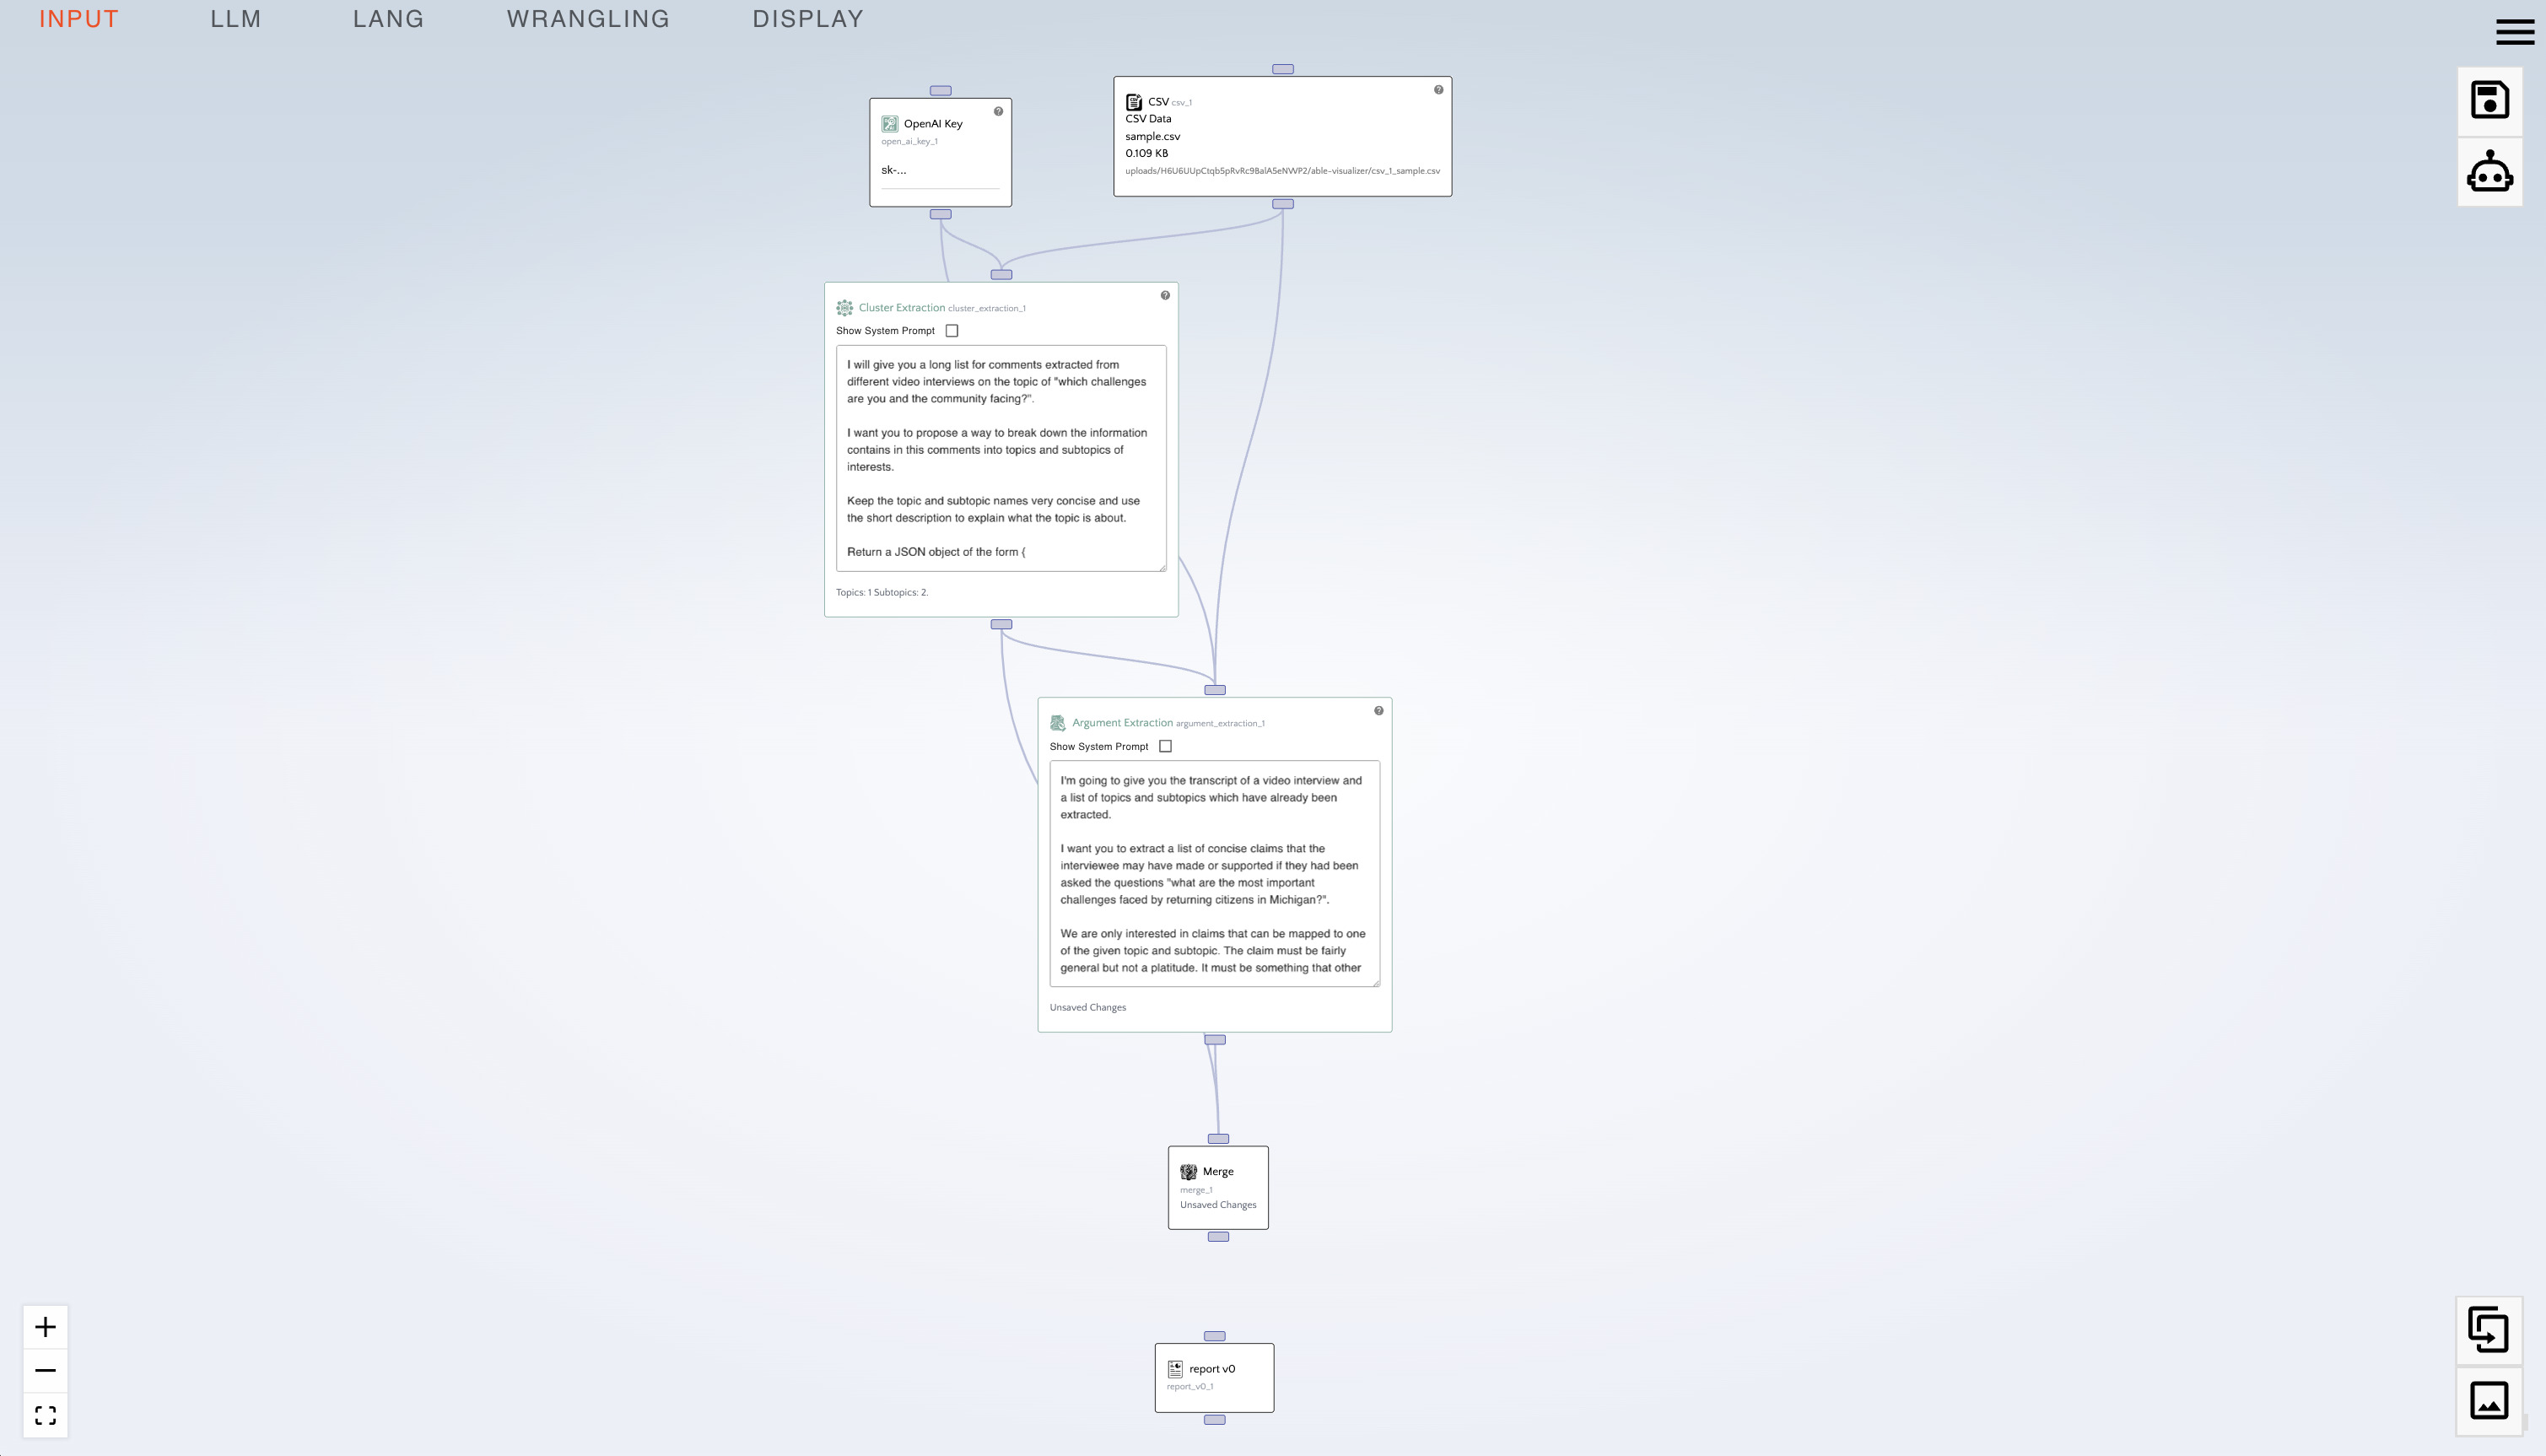
- From the LLM menu, drag in an "OpenAI Key" node.
- From the LLM menu, drag in a "Cluster Extraction" node.
- Right-click on the edge connecting the "CSV" and "Grid" node, and click "delete edge".
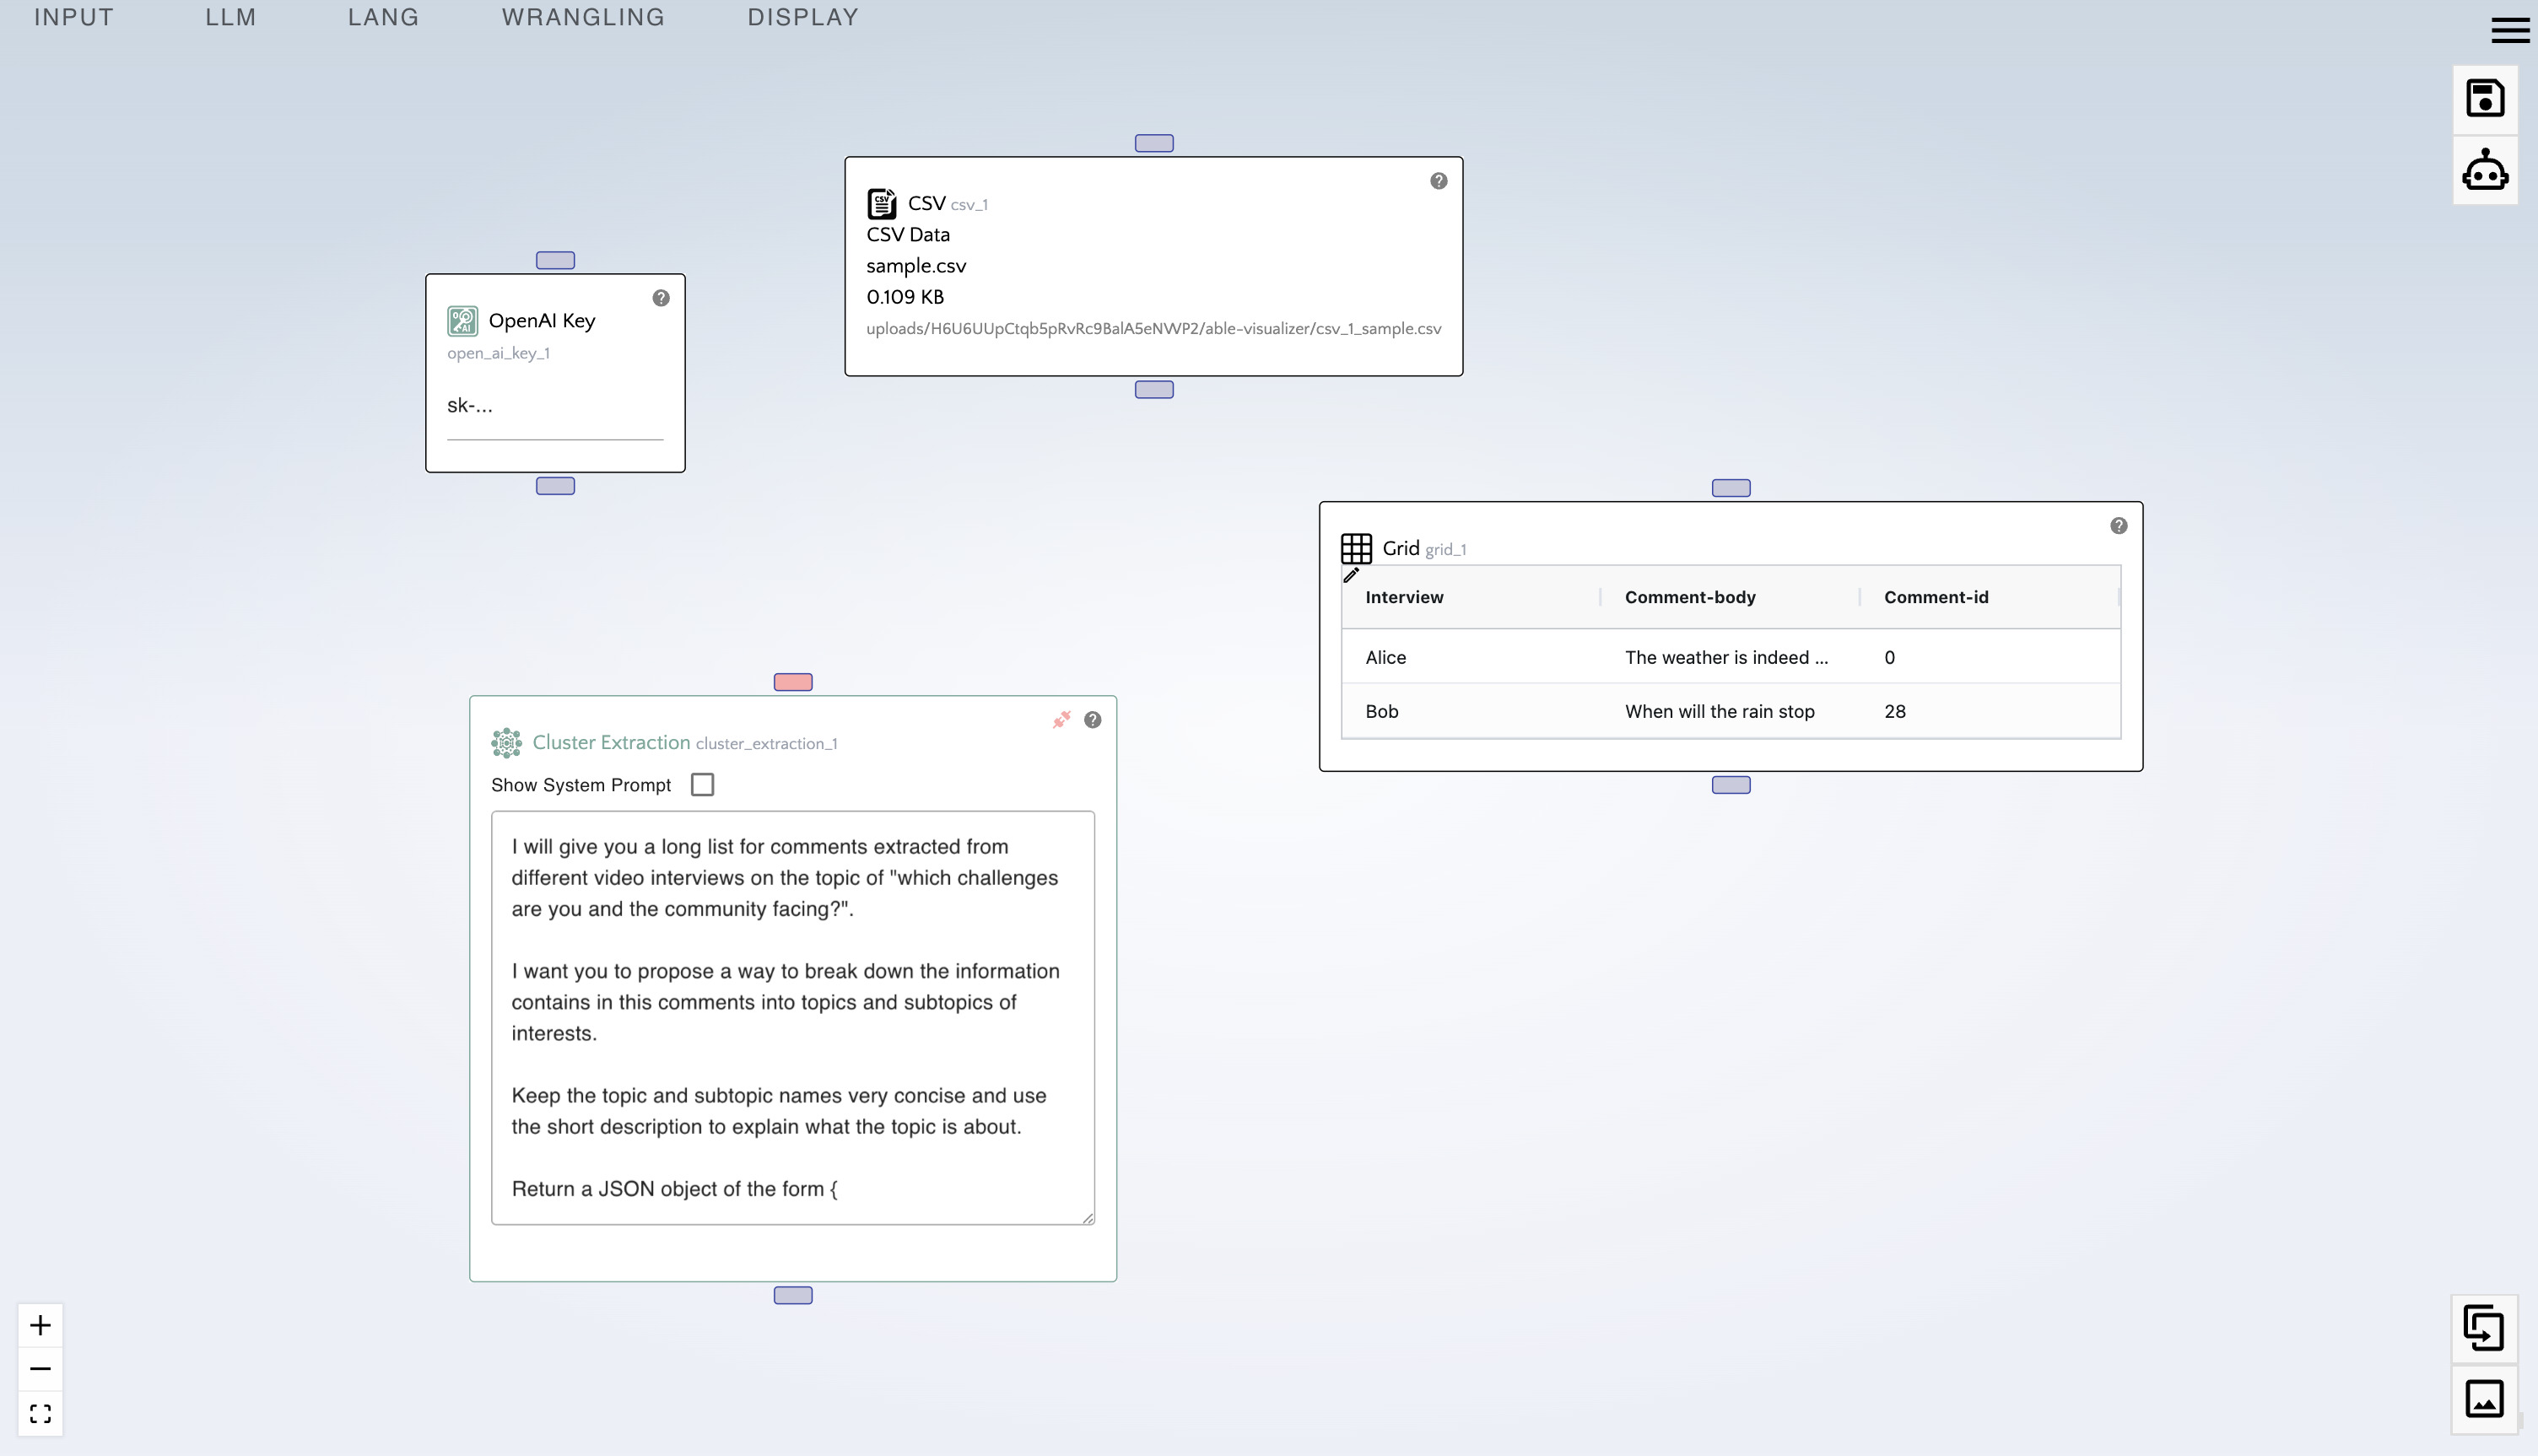
- Paste your OpenAI API key in the "OpenAI Key" node.
We are now ready to connect our building blocks.
Connecting the nodes
- Connect the bottom handle of the "OpenAI Key" node to the top handle of the "Cluster Extraction" node.
- Connect the bottom handle of the CSV node into the top handle of the "Cluster Extraction" node.
- At the top right of the "cluster extraction" node, notice an orange "disconnected" icon.
- Right click on the Cluster Extraction node
- In the "OpenAI Key" dropdown select
open_ai_key_1. - In the 'csv' dropdown select
csv_1.
- In the "OpenAI Key" dropdown select
- Click on the graph background to close the Context Menu.
- Notice the "disconnected" icon has now vanished.
- Connect the bottom handle of the "Cluster Extraction" node to the top handle of the "Grid" node.
- Reorganize your nodes so they flow nicely.
- Click the "Generate Report" (robot) icon at the top right.
After some time, the clusters have been extracted.
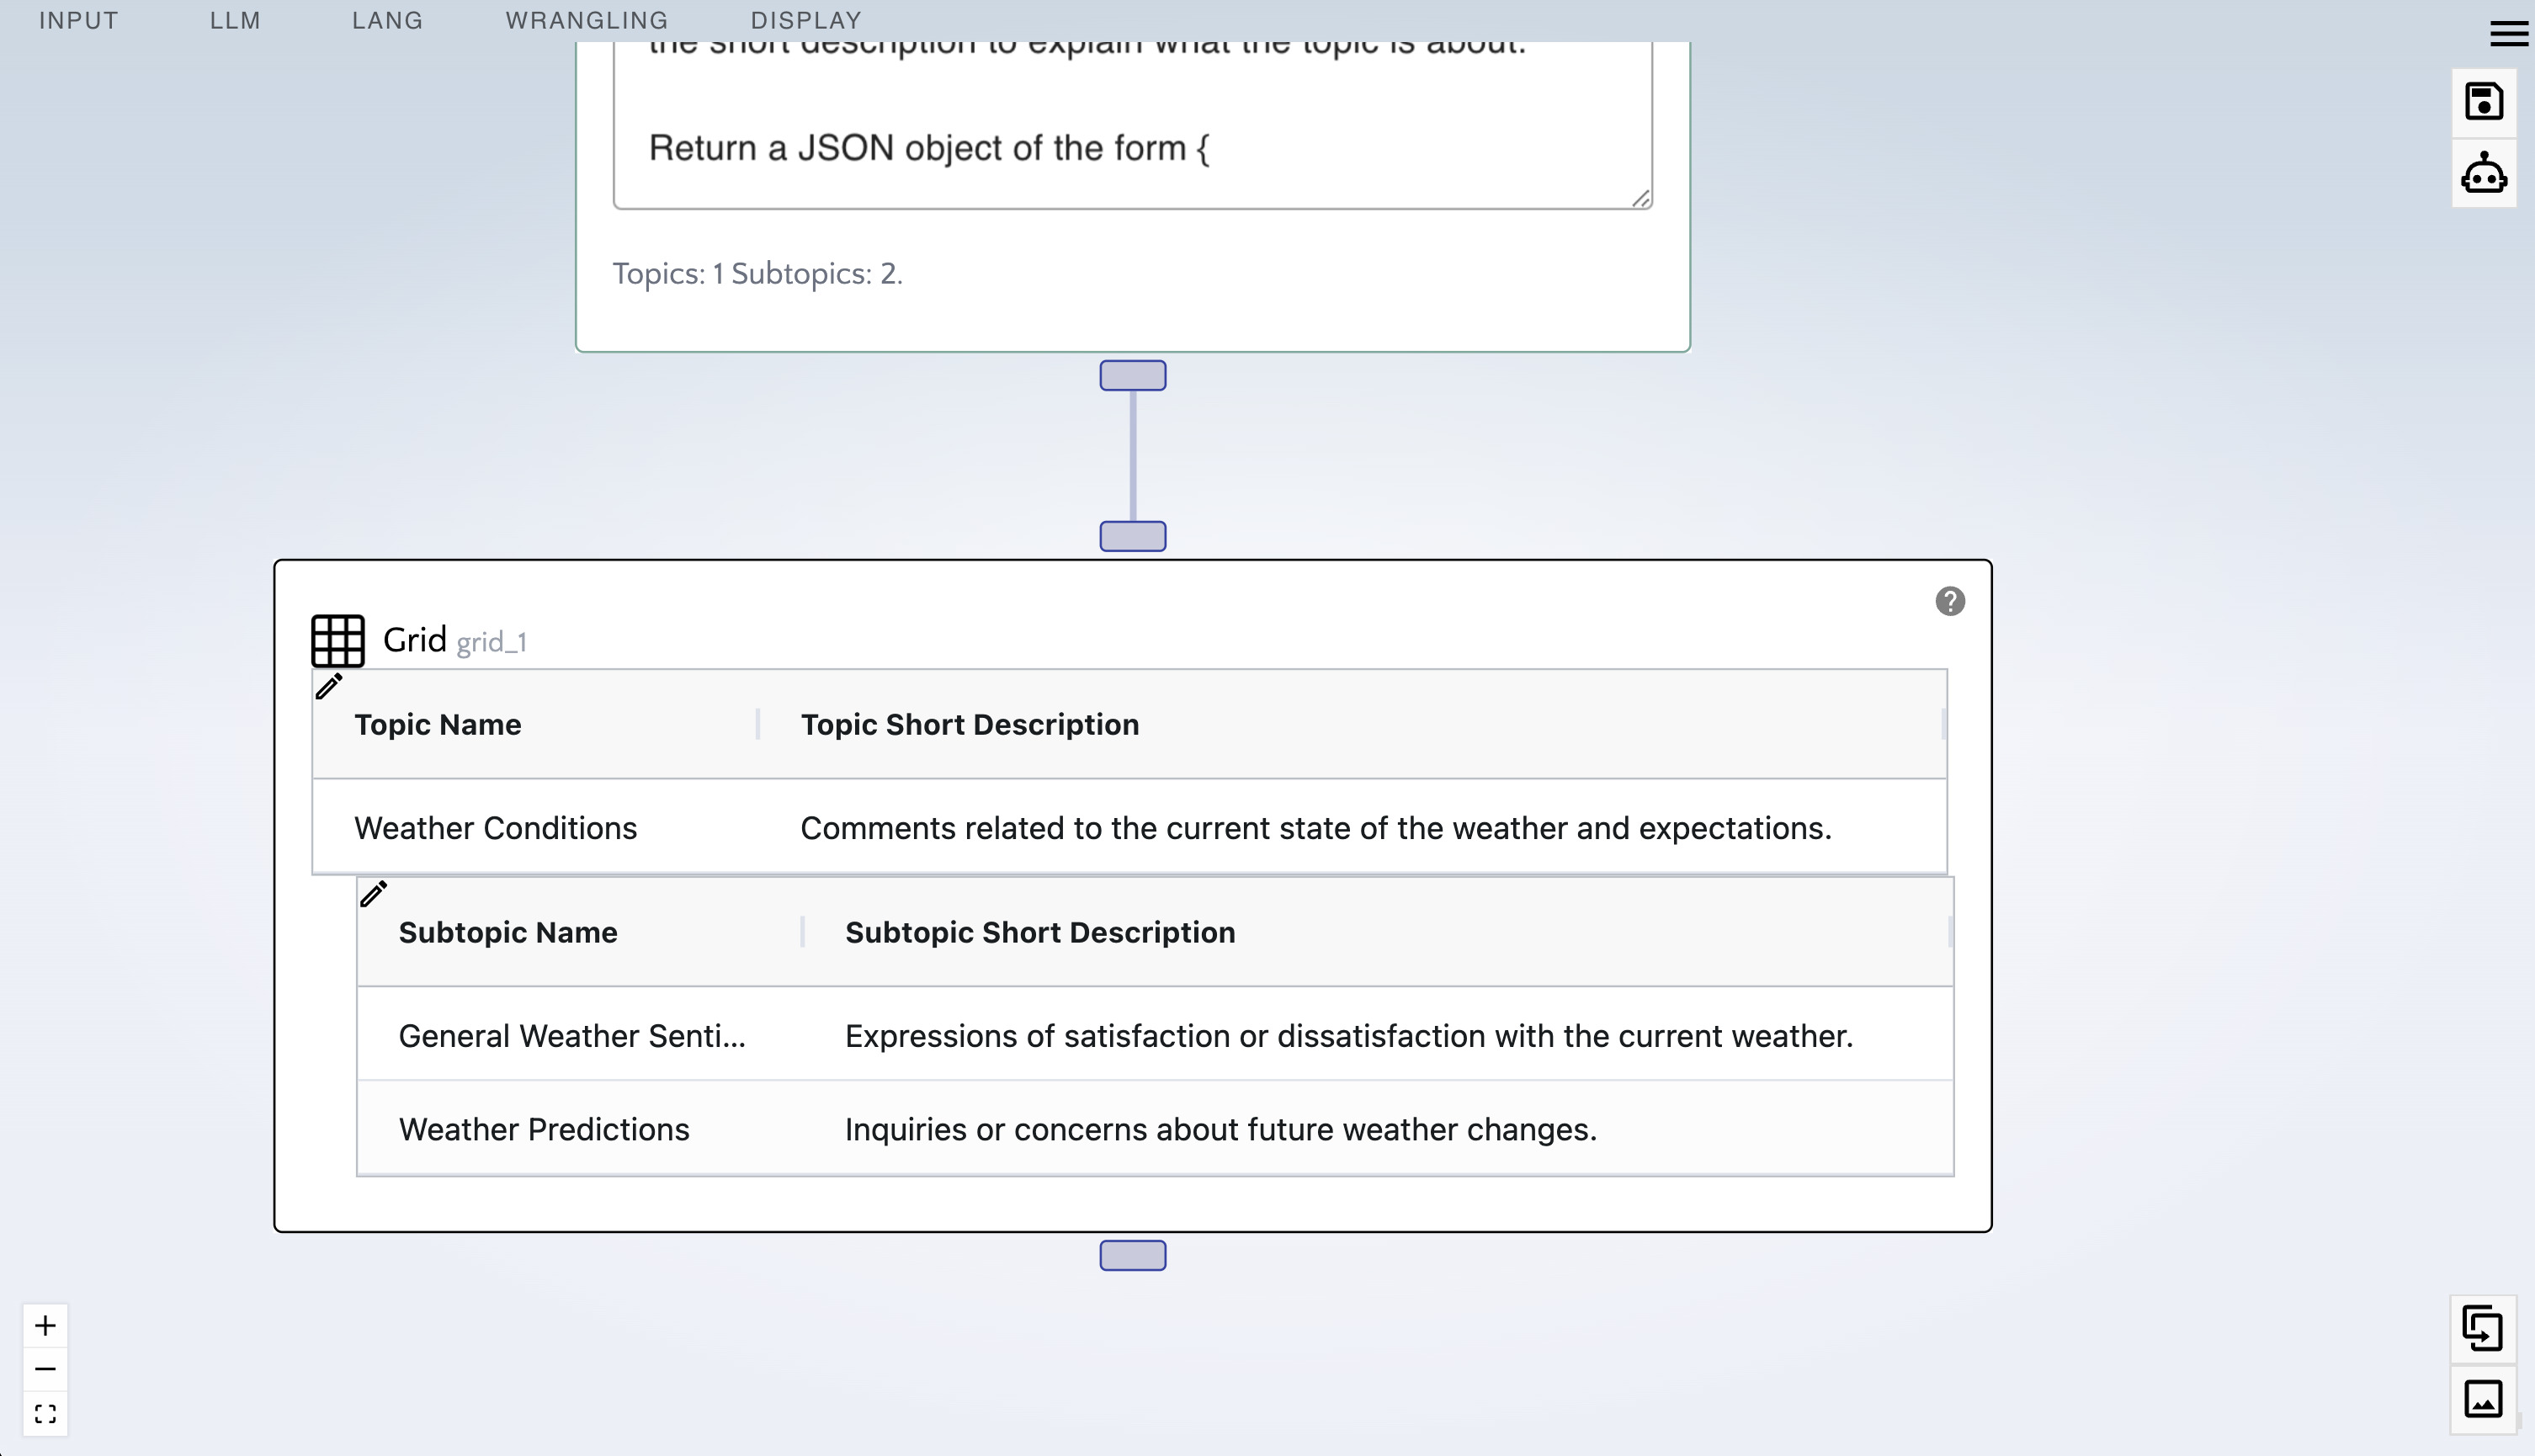
Notice our clusters contain "topics" and "subtopics" as well as short descriptions.
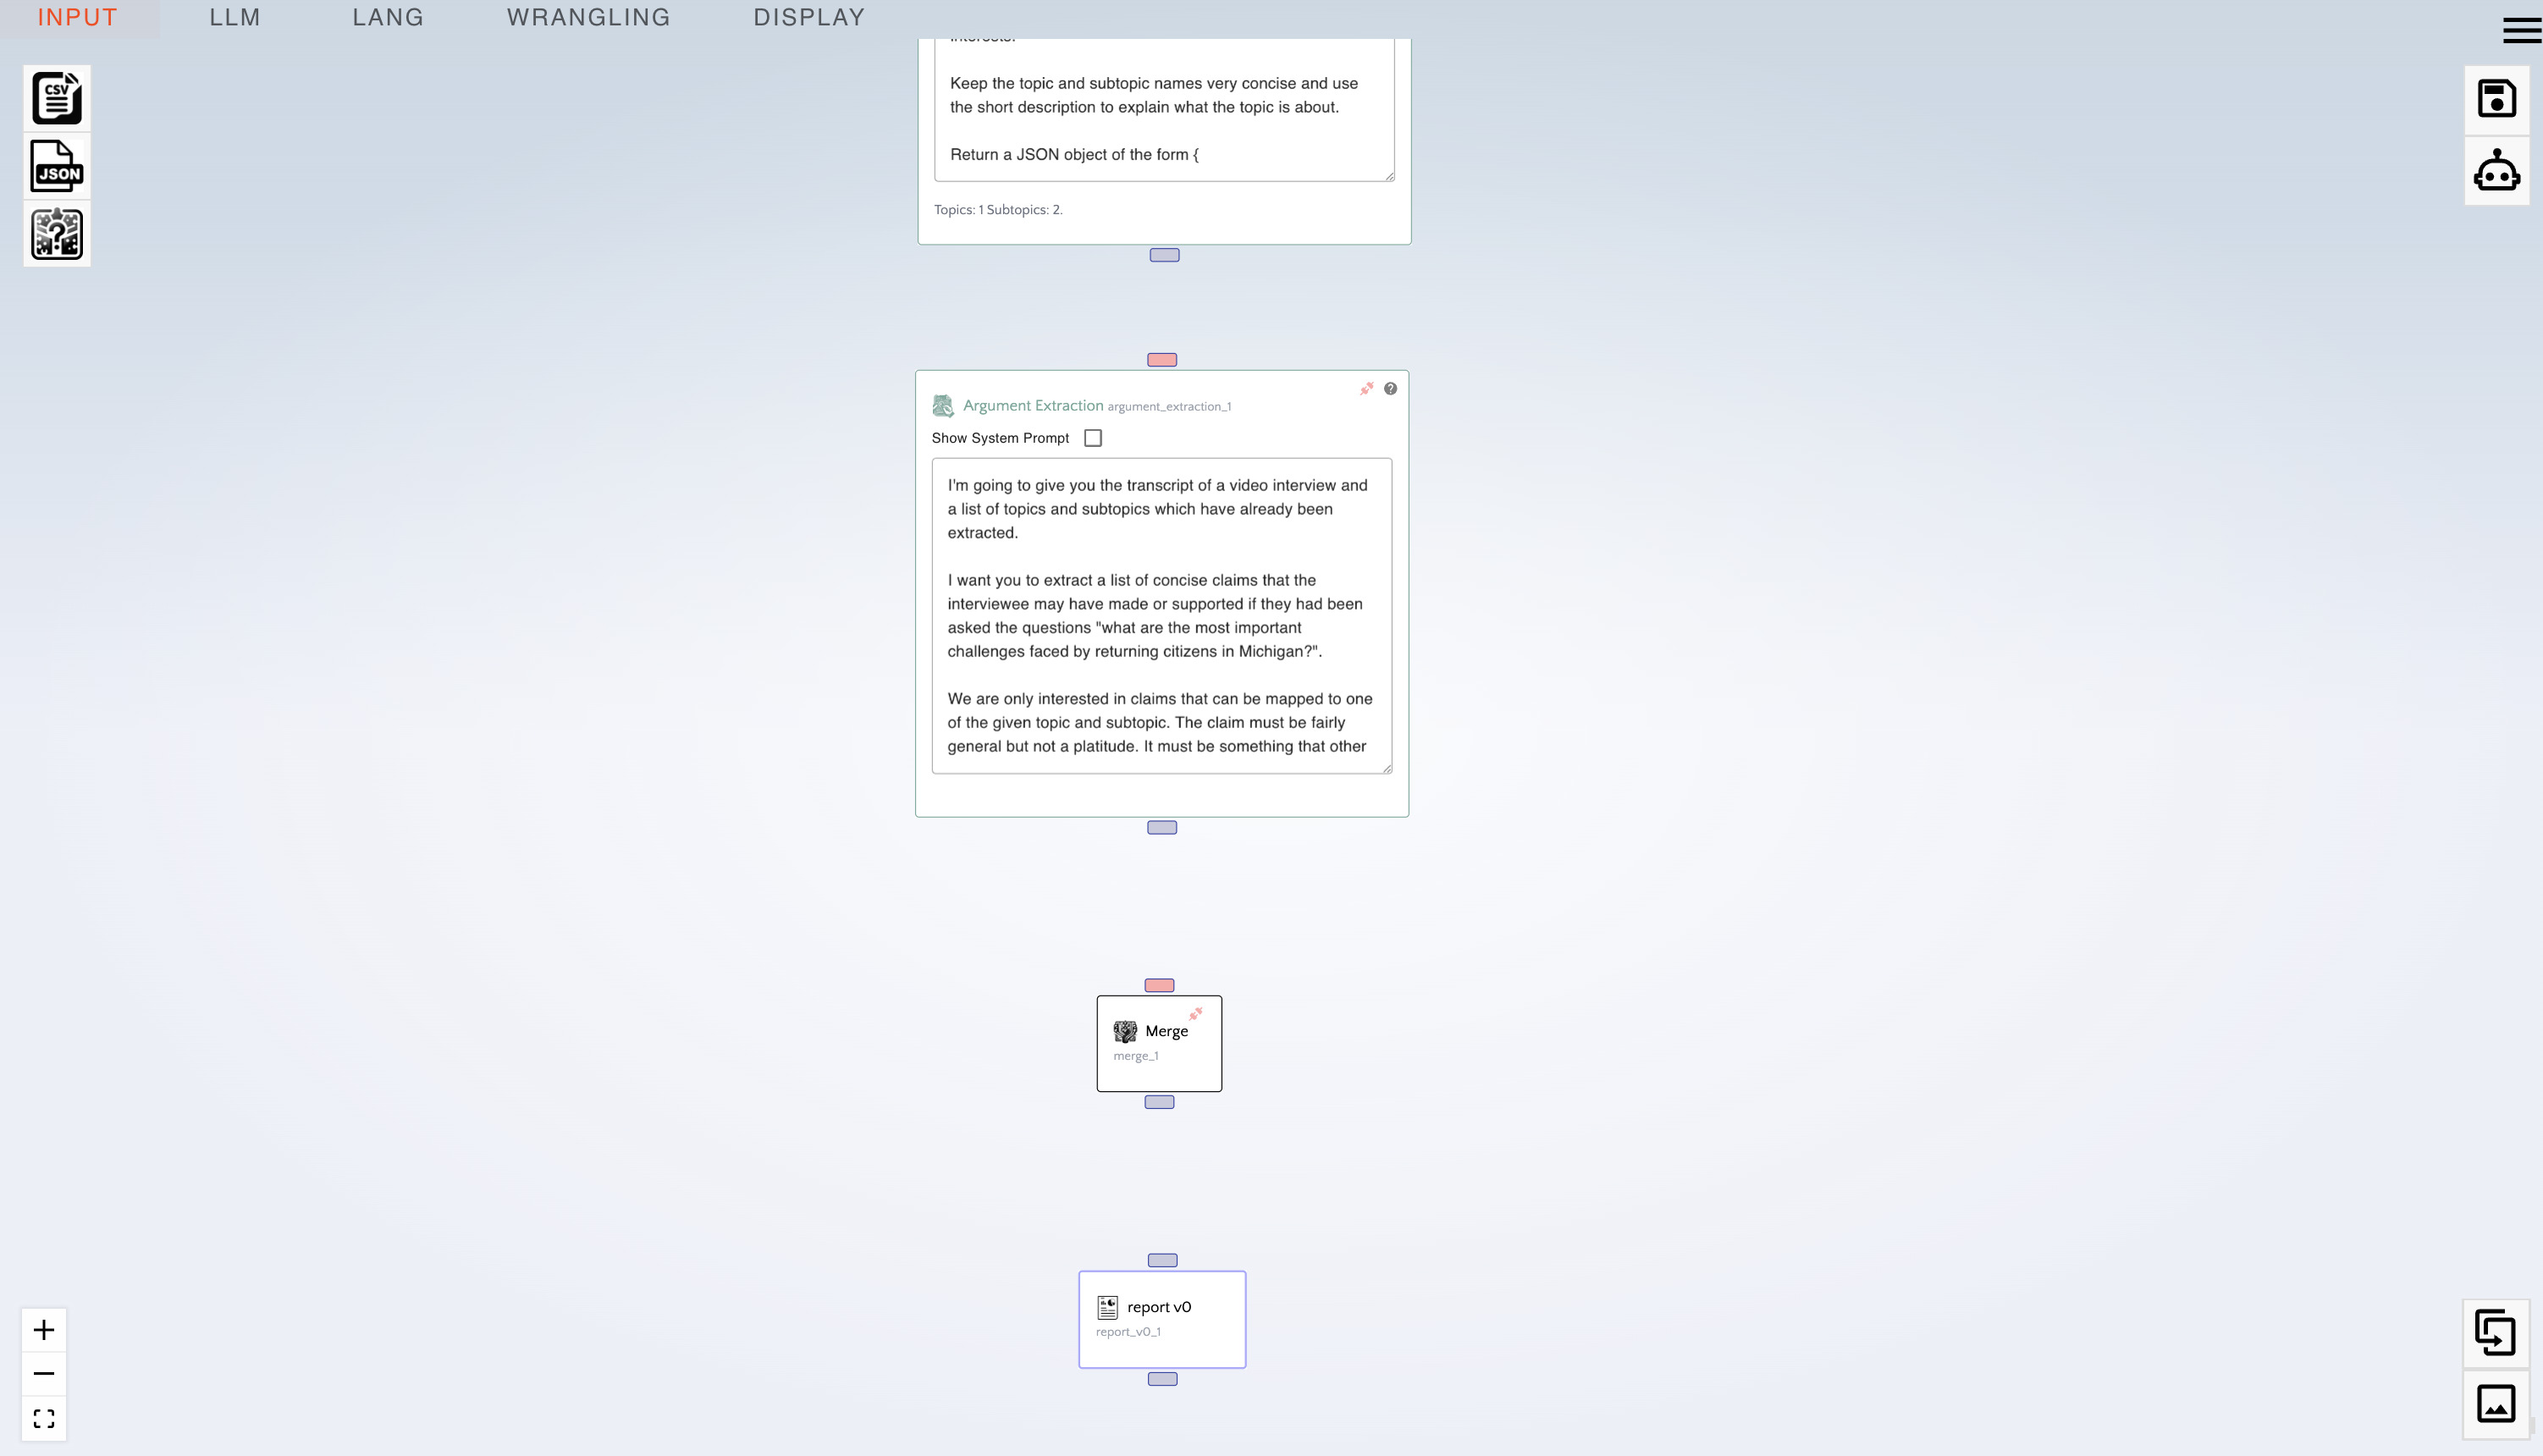
- Delete the "Grid" node by right clicking on it.
- From the LLM menu:
- Drag an "Argument Extraction" node.
- From the wrangling menu:
- Drag a "Merge" node
- From the display menu:
- Drag a "Report v0" node
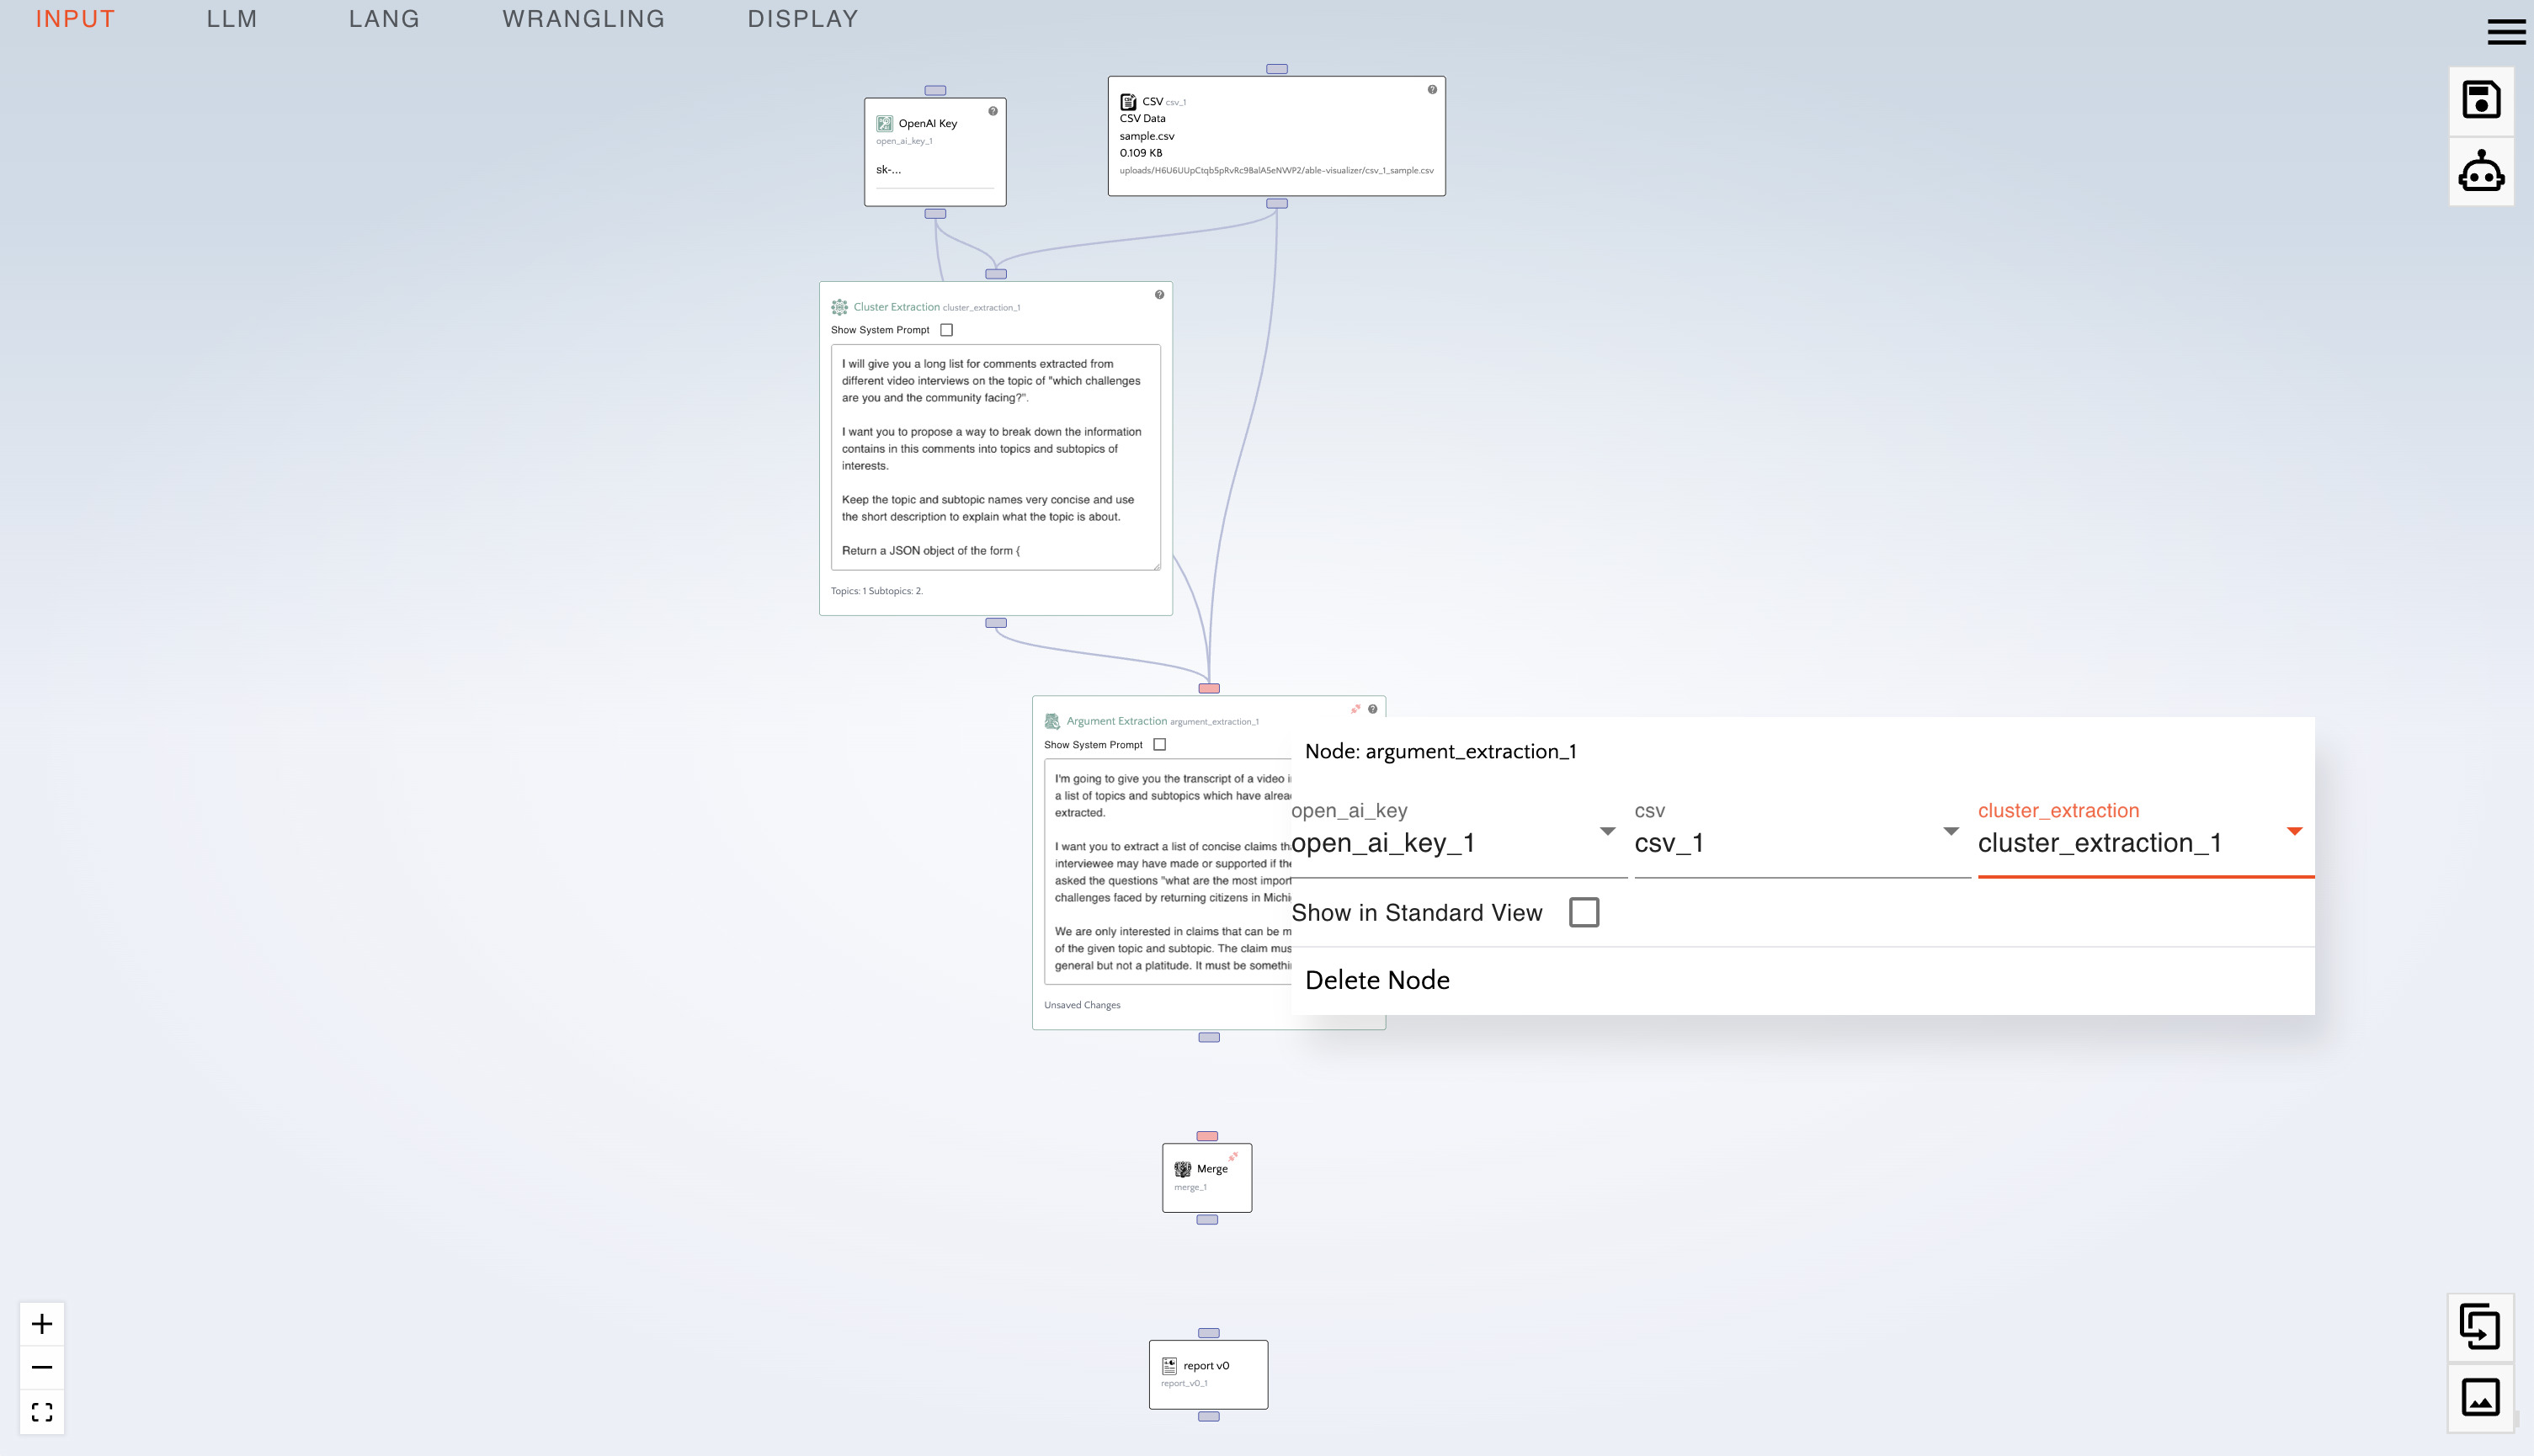
- Connect the following nodes into the "Argument Extraction" node:
- "CSV"
- "OpenAI Key"
- "Cluster Extraction"
- Right click on the "Argument Extraction" node, and:
- under
open_ai_keyclickopen_ai_key_1. - under
csvclickcsv_1. - under
cluster_extractionclickcluster_extraction_1.
- under
- Connect the following to the "Merge" node:
- "Cluster Extraction"
- "Argument Extraction"
- Right click on the "Argument Extraction" node, and:
- under
cluster_extractionclickcluster_extraction_1 - under
argument_extractionclickargument_extraction_1
- under
- Connect the "Merge" node to the "Report v0" node.
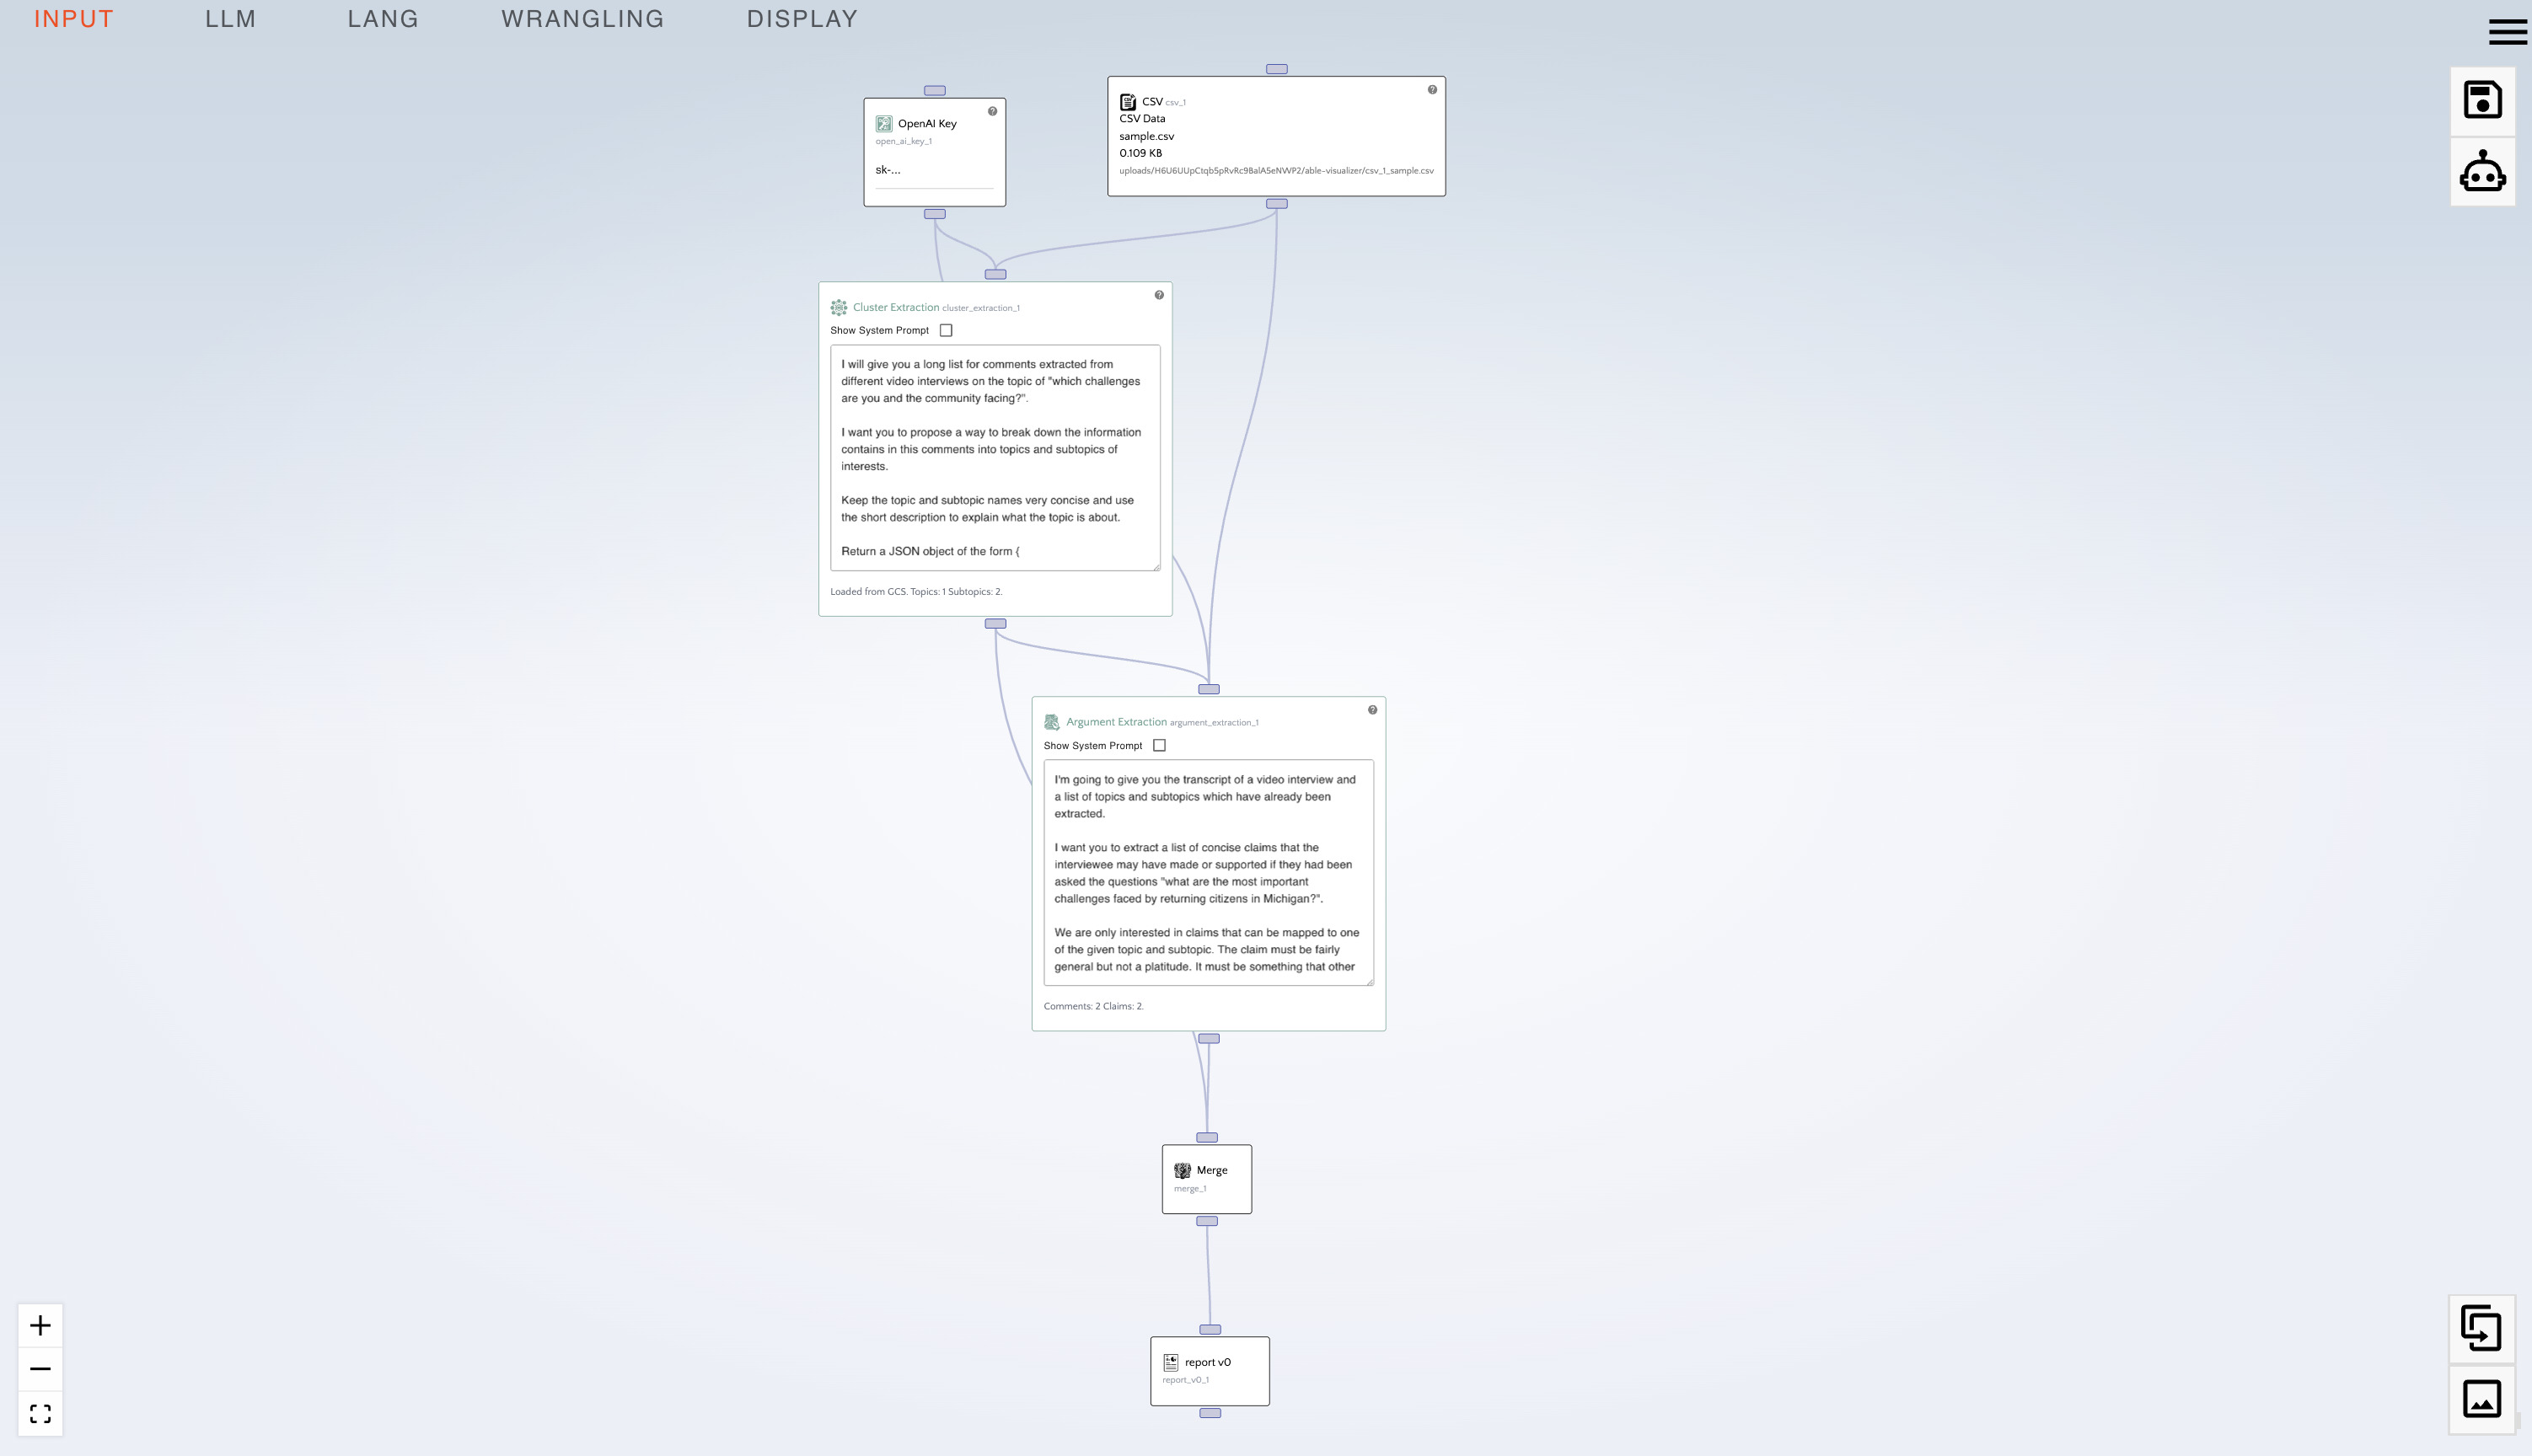
- Click the "Generate Report" (robot) button.
- In the top right menu click on "Standard View".
- Scroll down.
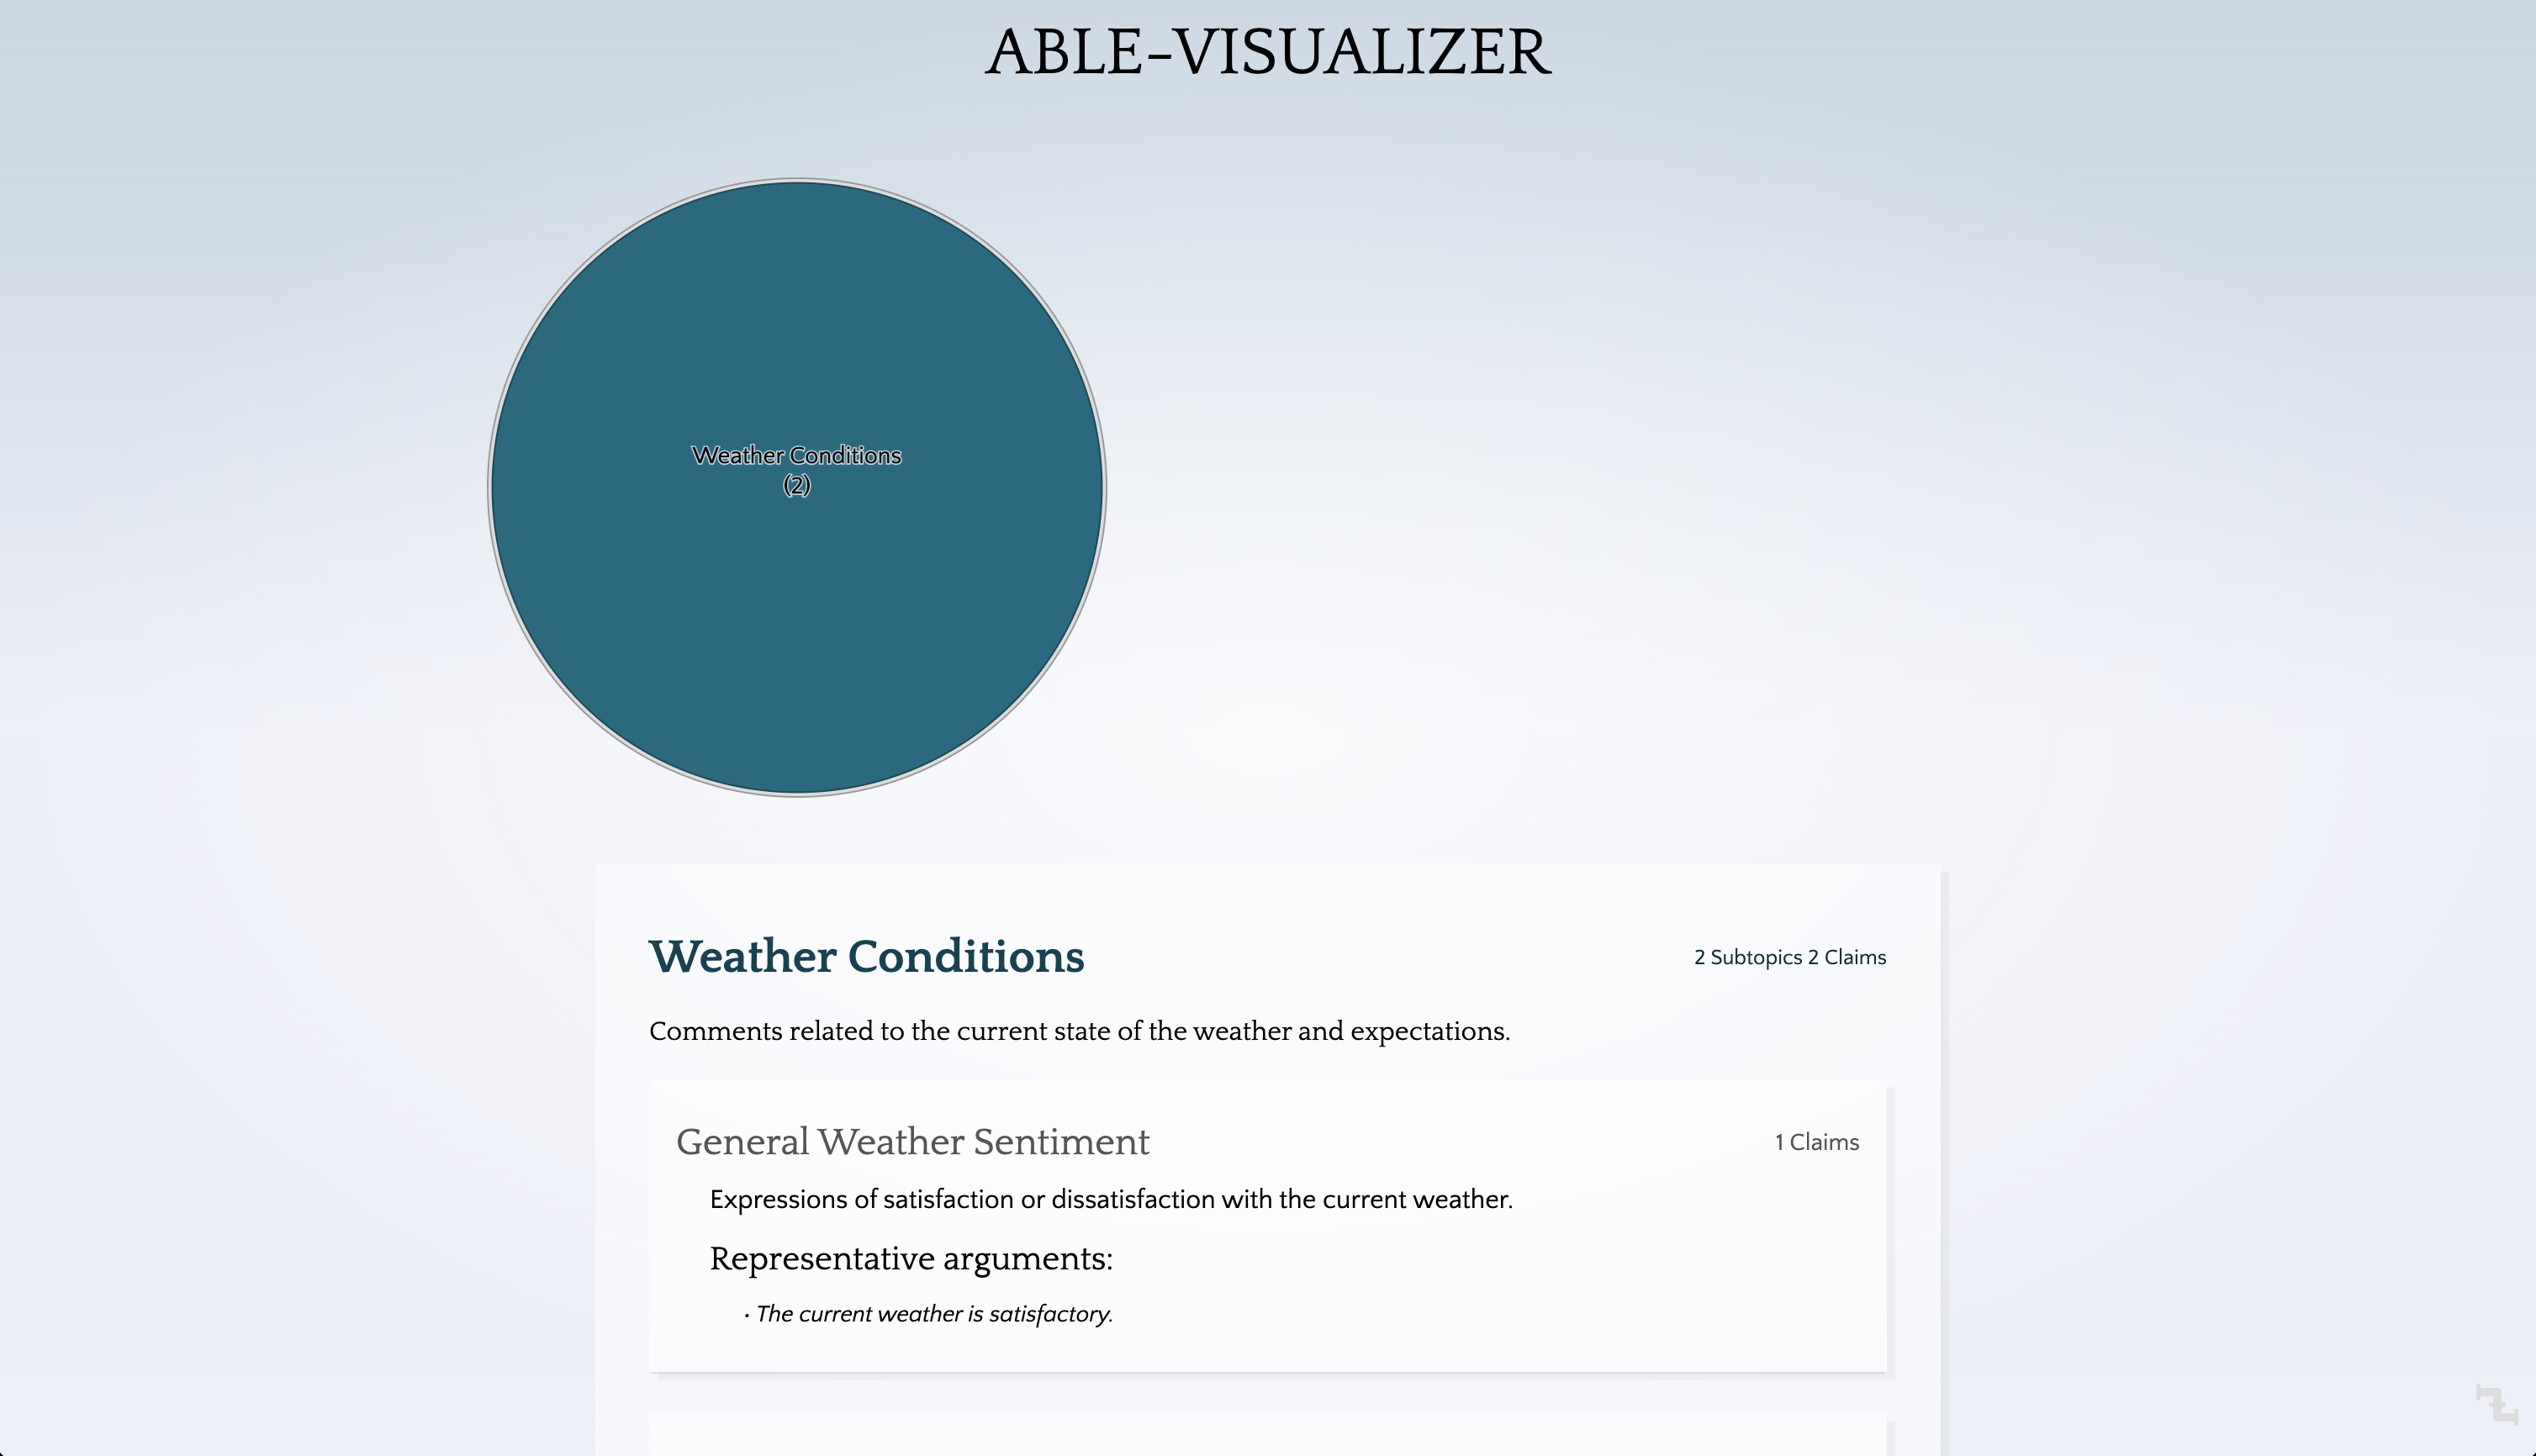
Your basic Talk to the City Turbo pipeline is now complete.
If you would like to hide certain nodes from the standard view:
- Go to the graph view.
- Right-click on the node you want to hide.
- Untick the "Show in standard view" checkbox.
- Click "save".
Try opening your report in a Private window, to view it as a logged out viewer would see it.
Exercises for the reader:
- Create a "Grid" node, and connect the bottom handle of a node to it.
- Click "generate report" (the robot icon).
- Study the data in the grid, and in the JSON mode of the Grid node.
- Repeat with other nodes.