
tttc-turbo documentation
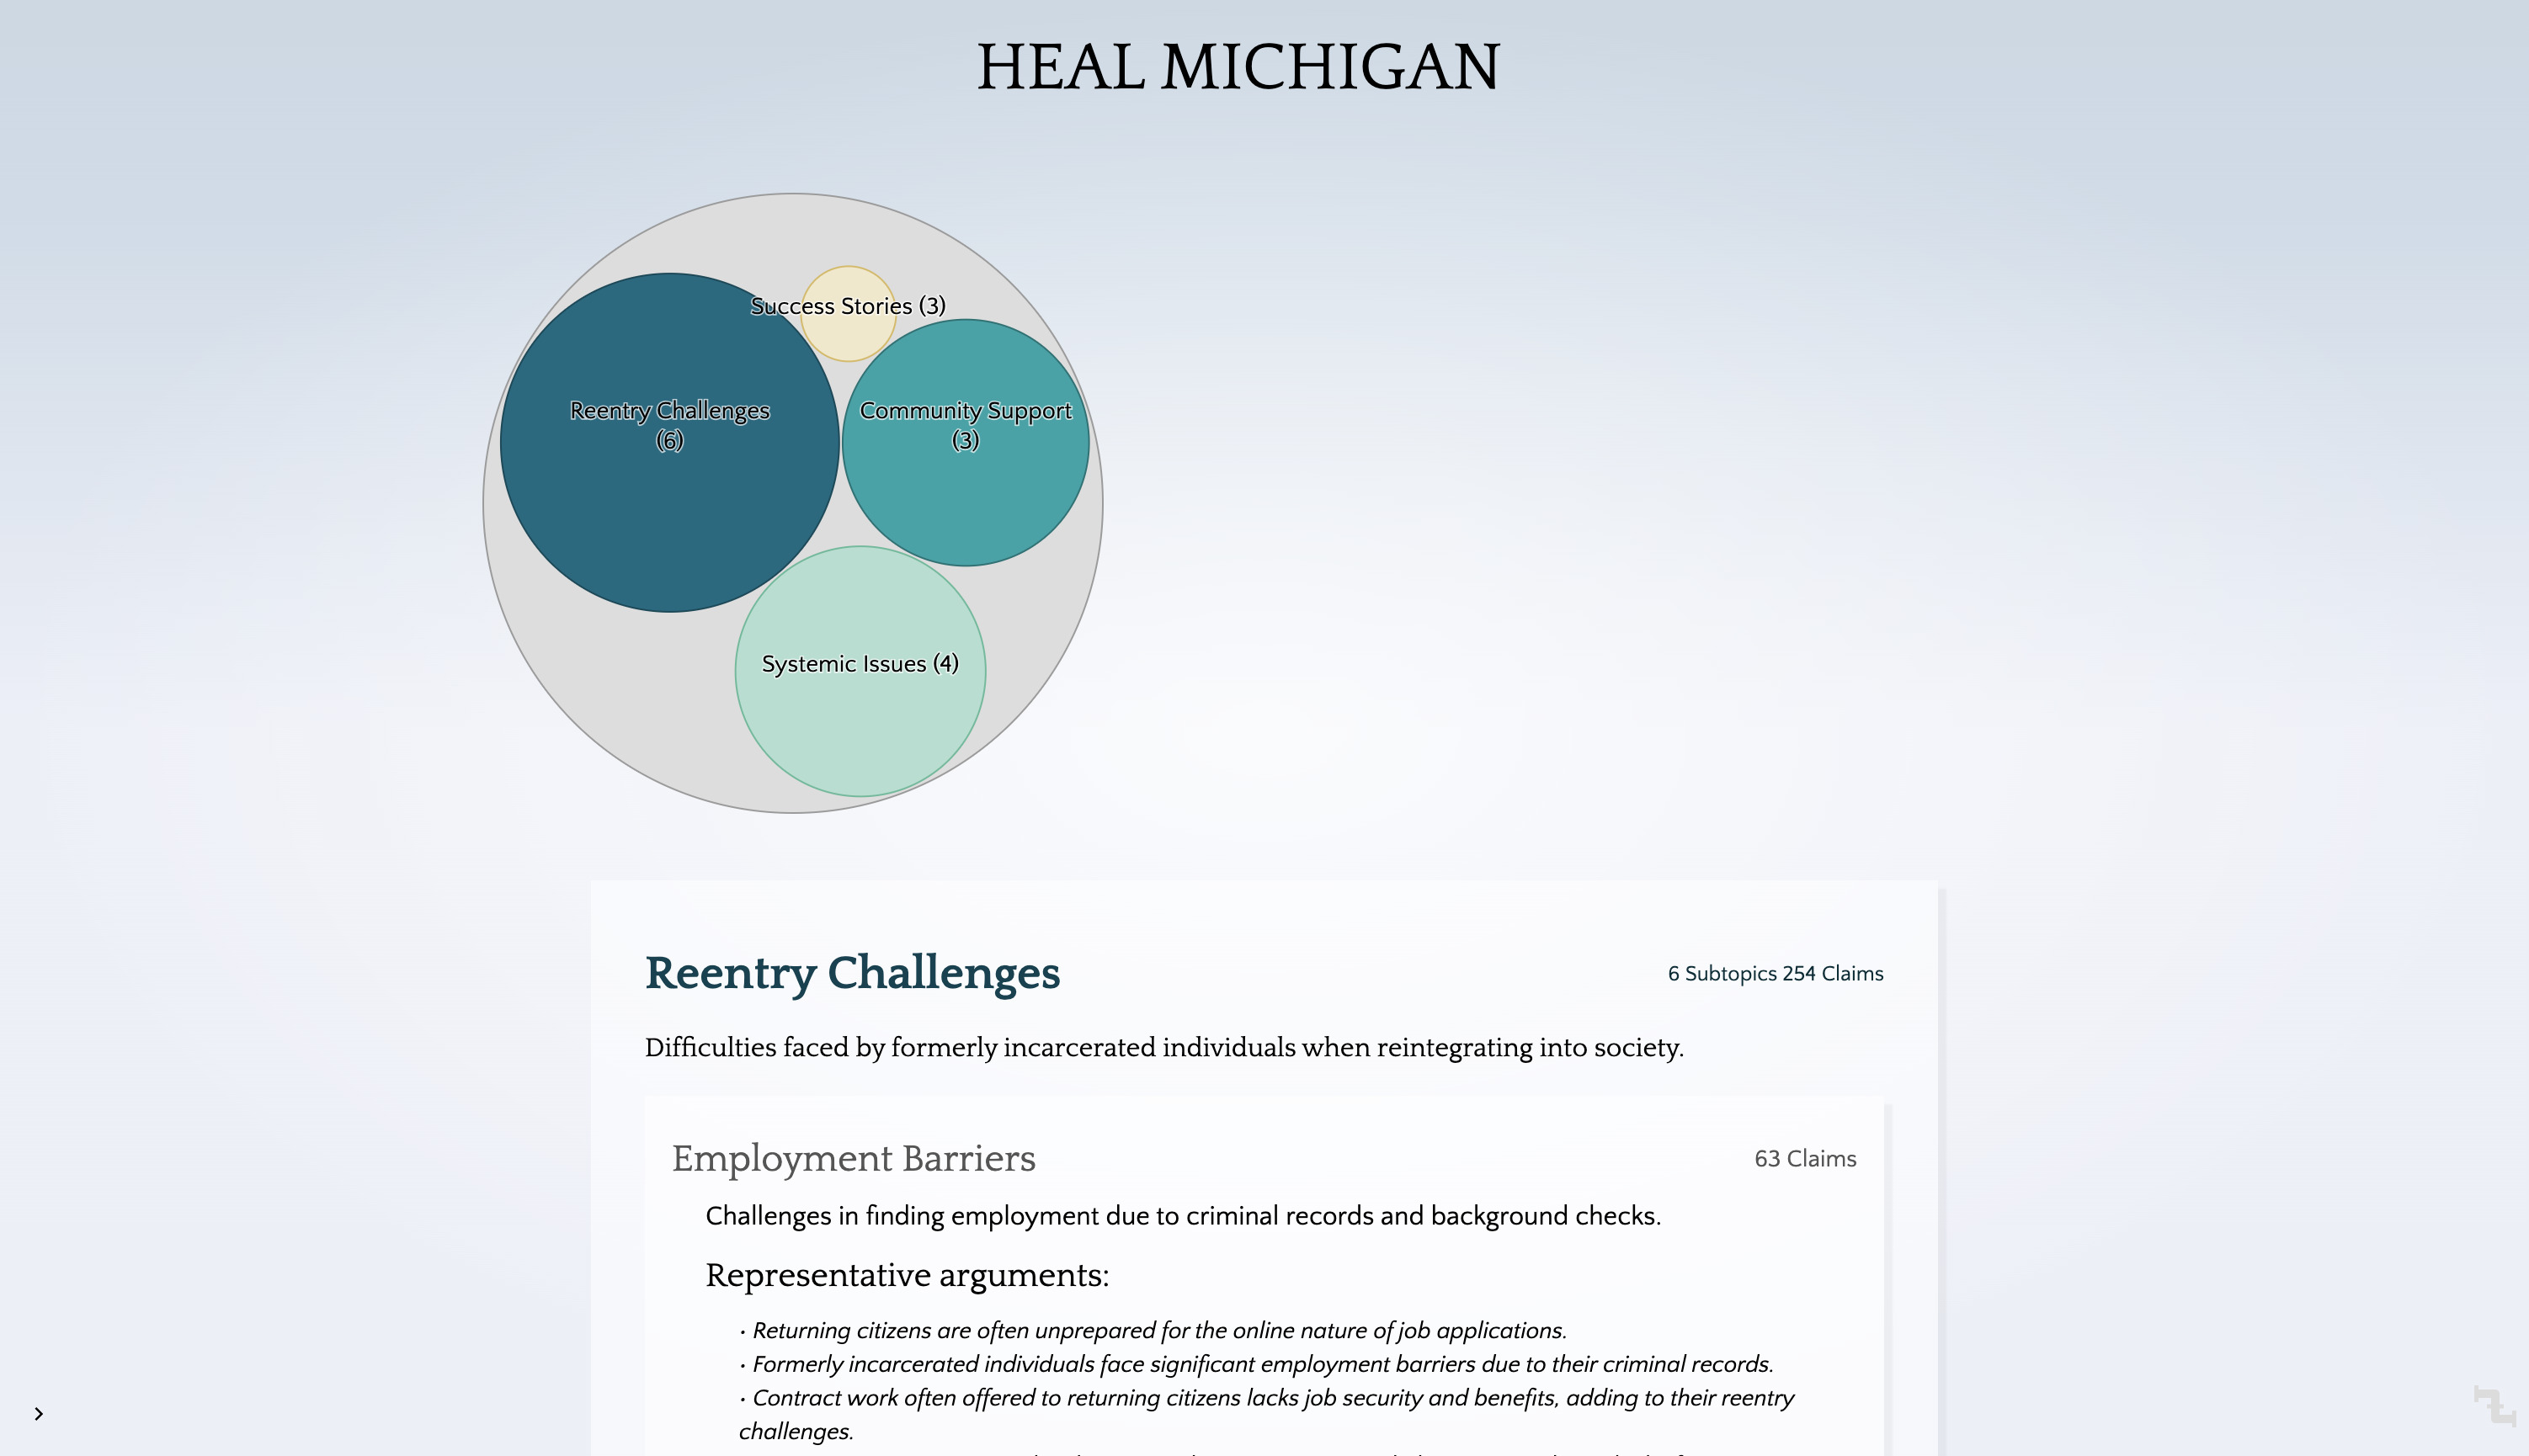
Talk to the City Turbo is an application that enables users to convert data they have acquired through interviews, surveys, forums, IM channels etc. into atomic "claims" that are categorized into topics and subtopics, and displayed in the form of a report.
These reports allow readers to explore the collected information in a structured manner that is also visually appealing.
There are therefore three broad categories of users:
- the anon viewer
- the reporter
- the AI pipeline engineer
The anon viewer
The anon viewer is anyone on the internet with a modern javascript enabled browser. These users are presented with the topics & subtopics graphics, the left sidebar, and the content (i.e the categorized claims).
The reporter
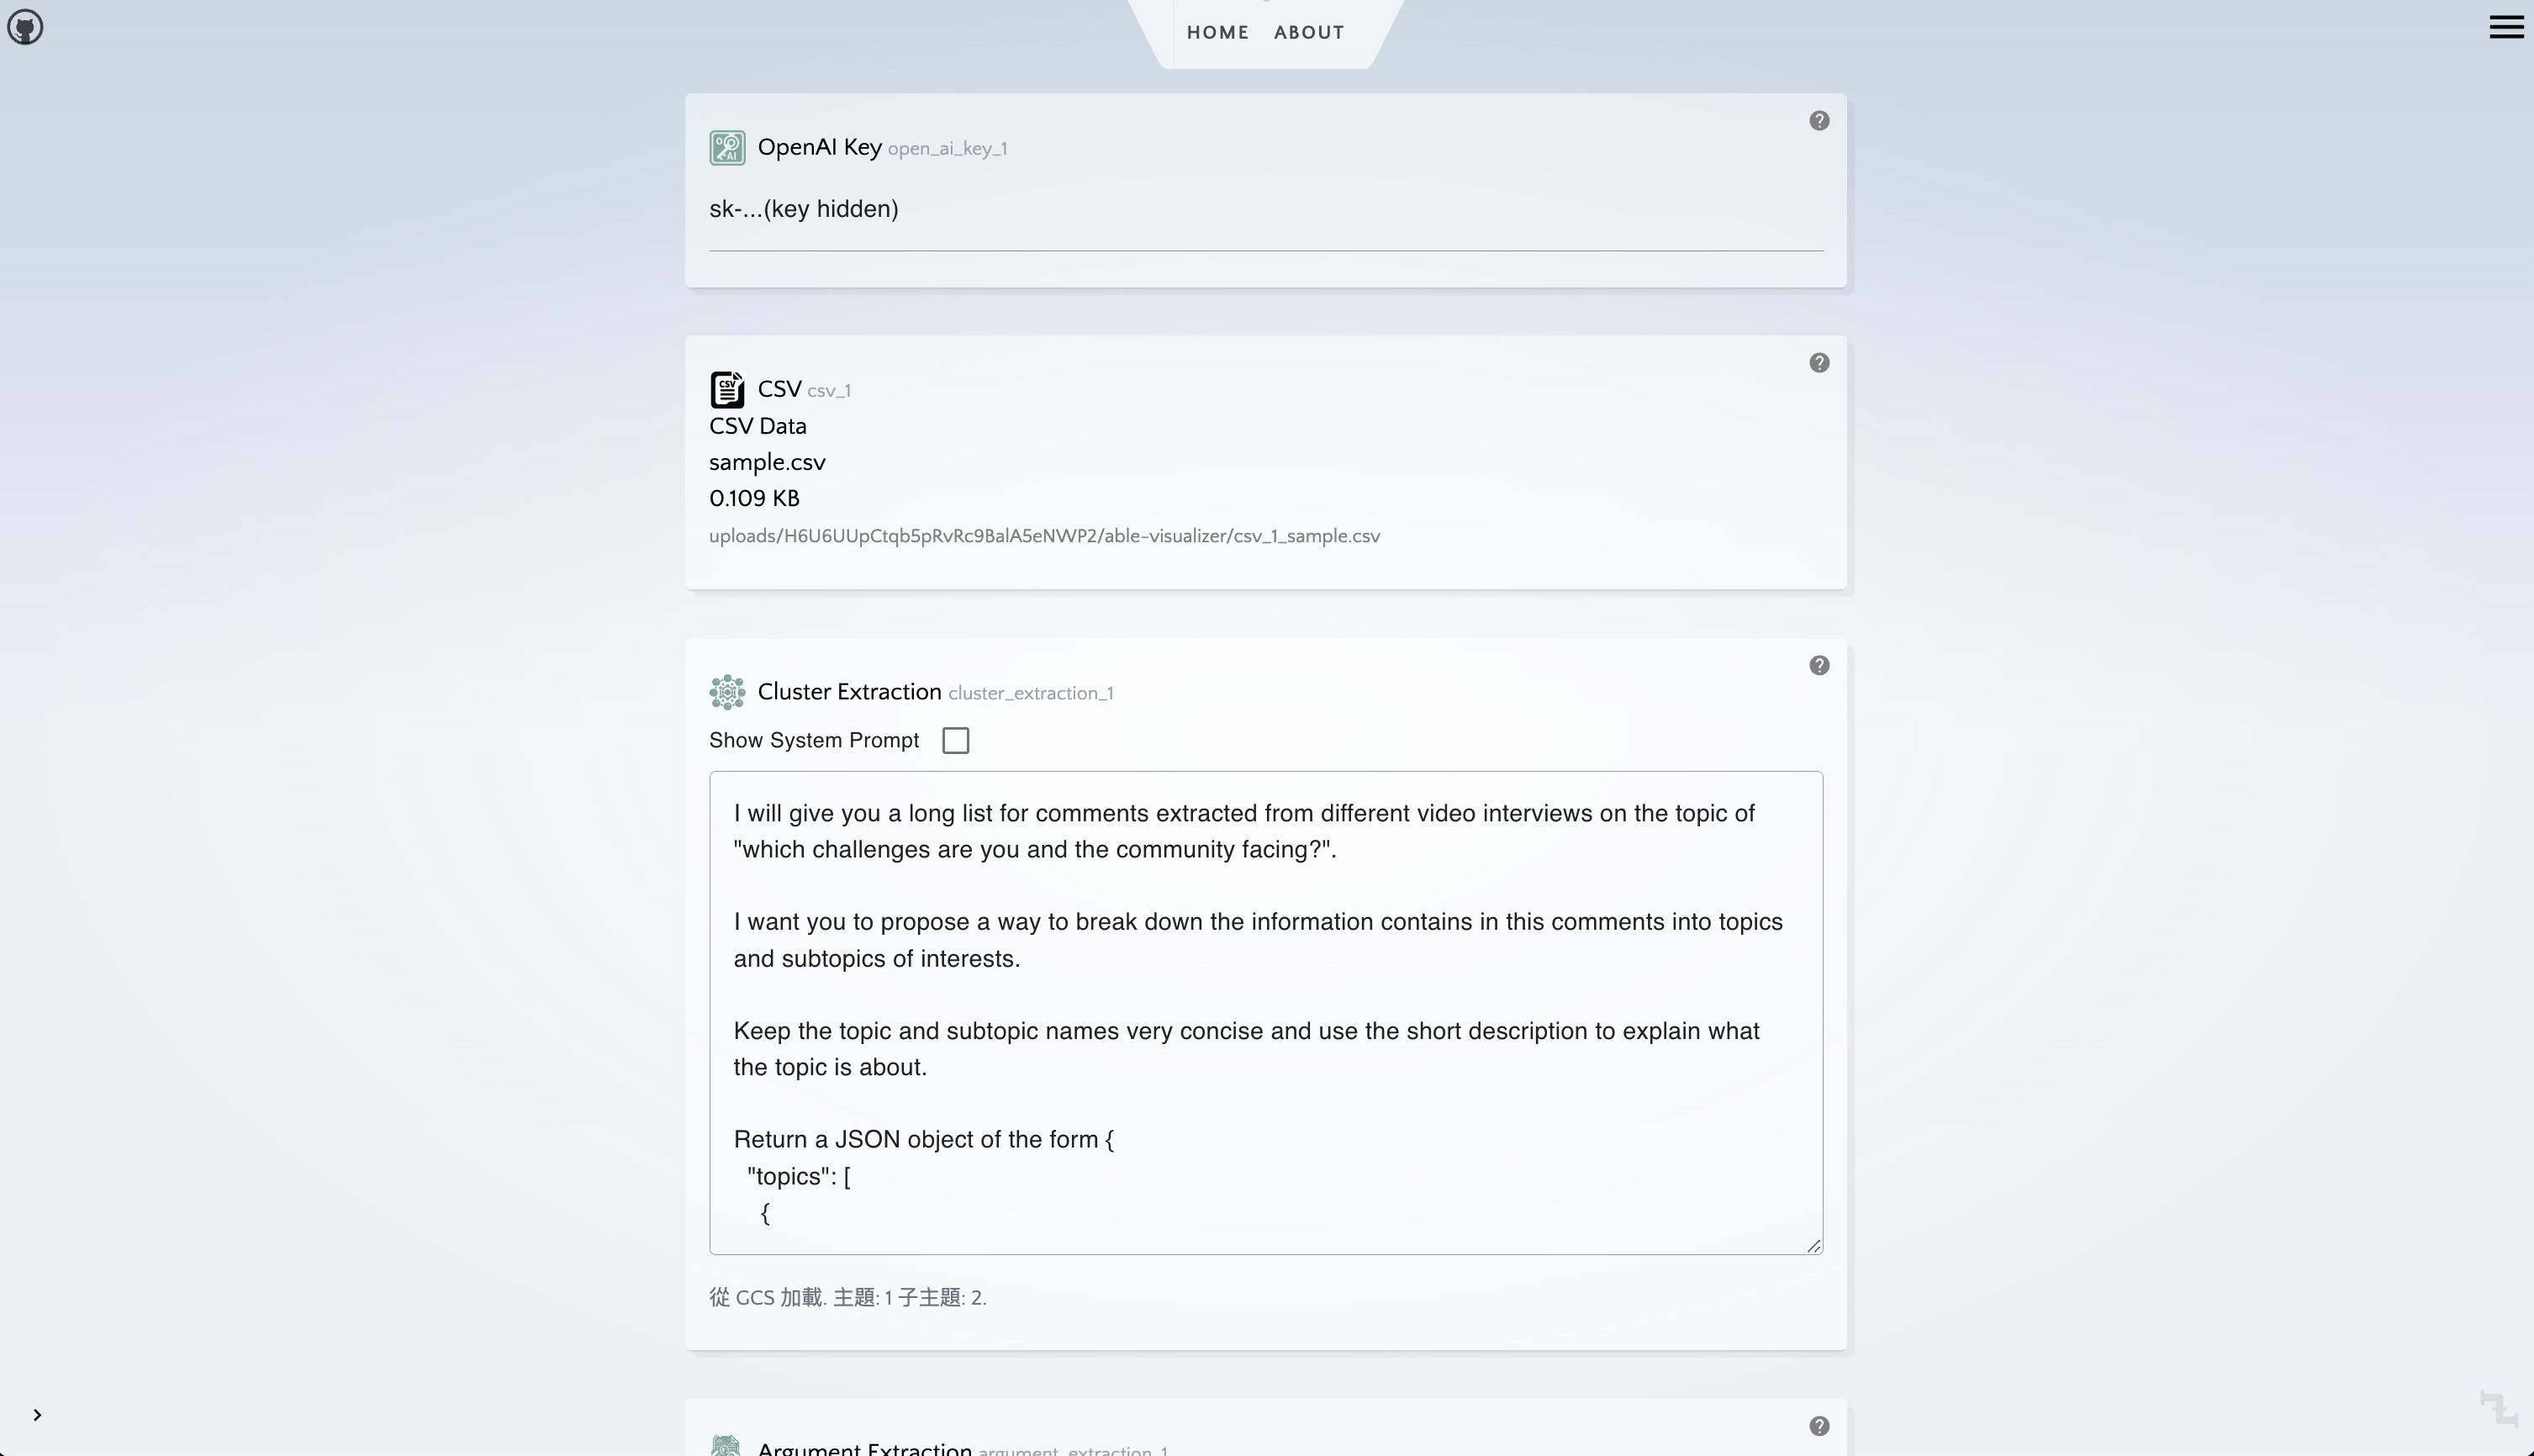
The reporter is the user who gathers the data, uploads it in CSV format, provides their OpenAI API key, and clicks "generate report".
The reporter is assumed to be non-technical. As such the extent of their computer related skills should be assumed to be no more than the ability to:
- log in using their Google account
- create a new report with the correct template
- uploading a CSV
- optional: modifying the prompt
- clicking the "generate report" button.
The AI pipeline engineer
tttc-turbo's UI and UX intends to make a clear distinction between the anon & reporter experience, versus the pipeline engineer's "backend" which is hidden away.
Please note the following AI Pipeline Engineering Guide #1 is not geared towards anon or reporters, but towards devs and engineers with an interest in building pipelines from scratch.
Here are also some more advanced articles delving into various aspects of pipeline building:
Nodes documentation
"Nodes" are the building blocks that, when joined to one another form a pipeline. To find out more about what each node does, you can refer to the nodes documentation:
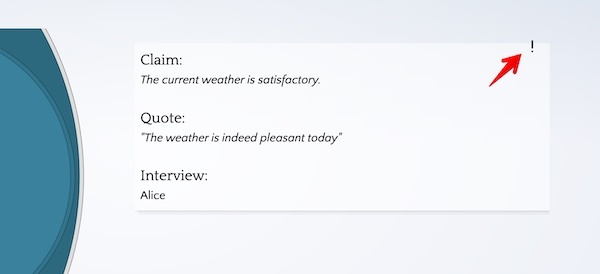
The feedback node enables members of the public to provide feedback on the accuracy of claims. Once added to a report, an exclamation point is available in the info panel that appears when clicking on claims and bubbles in the graph.
When the exclamation point is clicked, the user then has the option to label the claim as miscategorized, inaccurate, or not belonging to the dataset.
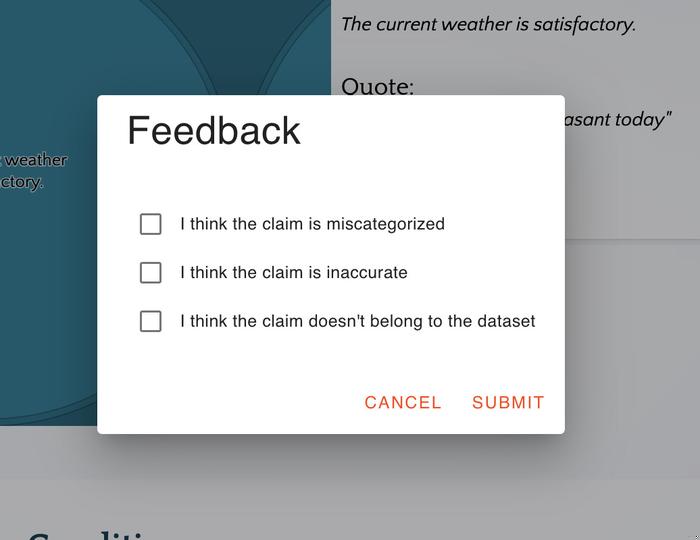
This feature is still currently in development, so the only functioning option is labeling a claim as not belonging to the dataset, which then filters out the claim on next load.